How Has Natural Alternatives International Inc’s (NASDAQ:NAII) Earnings Fared Against The Long Term Trend

Examining Natural Alternatives International Inc’s (NASDAQ:NAII) past track record of performance is an insightful exercise for investors. It allows us to reflect on whether or not the company has met or exceed expectations, which is a great indicator for future performance. Today I will assess NAII’s latest performance announced on 30 September 2018 and compare these figures to its longer term trend and industry movements.
See our latest analysis for Natural Alternatives International
Commentary On NAII’s Past Performance
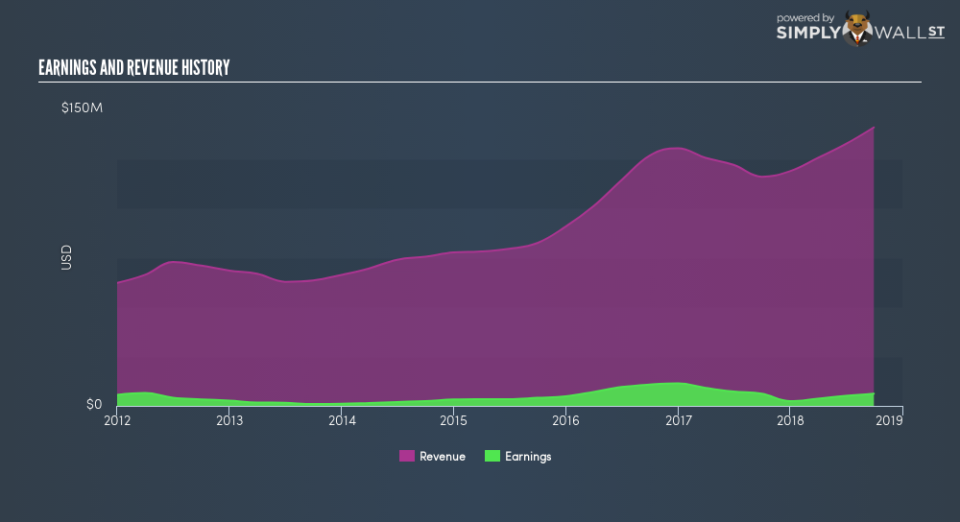
NAII’s trailing twelve-month earnings (from 30 September 2018) of US$6.2m has declined by -0.05% compared to the previous year.
Furthermore, this one-year growth rate has been lower than its average earnings growth rate over the past 5 years of 22%, indicating the rate at which NAII is growing has slowed down. Why is this? Well, let’s take a look at what’s occurring with margins and whether the whole industry is facing the same headwind.
In terms of returns from investment, Natural Alternatives International has fallen short of achieving a 20% return on equity (ROE), recording 8.6% instead. Furthermore, its return on assets (ROA) of 5.3% is below the US Personal Products industry of 12%, indicating Natural Alternatives International’s are utilized less efficiently. However, its return on capital (ROC), which also accounts for Natural Alternatives International’s debt level, has increased over the past 3 years from 16% to 18%.
What does this mean?
Natural Alternatives International’s track record can be a valuable insight into its earnings performance, but it certainly doesn’t tell the whole story. Companies that are profitable, but have unpredictable earnings, can have many factors affecting its business. I recommend you continue to research Natural Alternatives International to get a better picture of the stock by looking at:
Future Outlook: What are well-informed industry analysts predicting for NAII’s future growth? Take a look at our free research report of analyst consensus for NAII’s outlook.
Financial Health: Are NAII’s operations financially sustainable? Balance sheets can be hard to analyze, which is why we’ve done it for you. Check out our financial health checks here.
Other High-Performing Stocks: Are there other stocks that provide better prospects with proven track records? Explore our free list of these great stocks here.
NB: Figures in this article are calculated using data from the trailing twelve months from 30 September 2018. This may not be consistent with full year annual report figures.
To help readers see past the short term volatility of the financial market, we aim to bring you a long-term focused research analysis purely driven by fundamental data. Note that our analysis does not factor in the latest price-sensitive company announcements.
The author is an independent contributor and at the time of publication had no position in the stocks mentioned. For errors that warrant correction please contact the editor at editorial-team@simplywallst.com.
