Are Norfolk Southern Corporation’s (NYSE:NSC) Interest Costs Too High?

There are a number of reasons that attract investors towards large-cap companies such as Norfolk Southern Corporation (NYSE:NSC), with a market cap of $43.66B. Risk-averse investors who are attracted to diversified streams of revenue and strong capital returns tend to seek out these large companies. But, the key to extending previous success is in the health of the company’s financials. I will provide an overview of Norfolk Southern’s financial liquidity and leverage to give you an idea of Norfolk Southern’s position to take advantage of potential acquisitions or comfortably endure future downturns. Note that this information is centred entirely on financial health and is a high-level overview, so I encourage you to look further into NSC here. See our latest analysis for Norfolk Southern
How much cash does NSC generate through its operations?
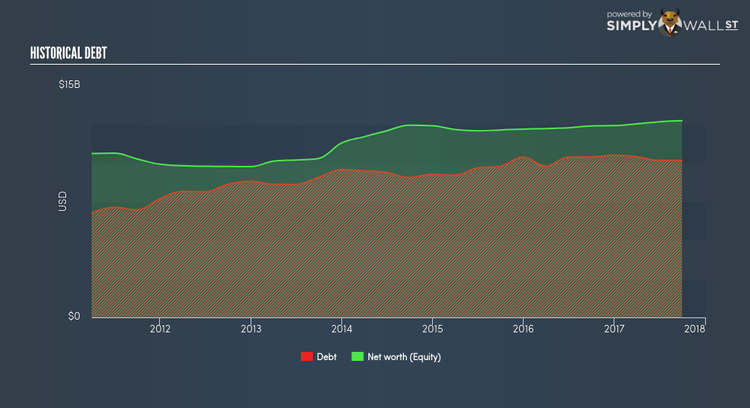
Over the past year, NSC has maintained its debt levels at around $10,492.0M – this includes both the current and long-term debt. At this current level of debt, NSC currently has $956.0M remaining in cash and short-term investments for investing into the business. Additionally, NSC has generated $3,034.0M in operating cash flow over the same time period, leading to an operating cash to total debt ratio of 28.92%, signalling that NSC’s debt is appropriately covered by operating cash. This ratio can also be interpreted as a measure of efficiency as an alternative to return on assets. In NSC’s case, it is able to generate 0.29x cash from its debt capital.
Does NSC’s liquid assets cover its short-term commitments?
At the current liabilities level of $2,339.0M liabilities, the company has not been able to meet these commitments with a current assets level of $2,291.0M, leading to a 0.98x current account ratio. which is under the appropriate industry ratio of 3x.
Can NSC service its debt comfortably?
NSC is a relatively highly levered company with a debt-to-equity of 79.83%. This isn’t surprising for large-caps, as equity can often be more expensive to issue than debt, plus interest payments are tax deductible. Accordingly, large companies often have an advantage over small-caps through lower cost of capital due to cheaper financing. The sustainability of NSC’s debt levels can be assessed by comparing the company’s interest payments to earnings. Ideally, earnings before interest and tax (EBIT) should cover net interest by at least three times. In NSC’s case, the ratio of 6.02x suggests that interest is appropriately covered. Large-cap investments like NSC are often believed to be a safe investment due to their ability to pump out ample earnings multiple times its interest payments.
Next Steps:
NSC’s high cash coverage means that, although its debt levels are high, the company is able to utilise its borrowings efficiently in order to generate cash flow. Though its low liquidity raises concerns over whether current asset management practices are properly implemented for the large-cap. Keep in mind I haven’t considered other factors such as how NSC has been performing in the past. I recommend you continue to research Norfolk Southern to get a more holistic view of the stock by looking at:
1. Future Outlook: What are well-informed industry analysts predicting for NSC’s future growth? Take a look at our free research report of analyst consensus for NSC’s outlook.
2. Valuation: What is NSC worth today? Is the stock undervalued, even when its growth outlook is factored into its intrinsic value? The intrinsic value infographic in our free research report helps visualize whether NSC is currently mispriced by the market.
3. Other High-Performing Stocks: Are there other stocks that provide better prospects with proven track records? Explore our free list of these great stocks here.
To help readers see pass the short term volatility of the financial market, we aim to bring you a long-term focused research analysis purely driven by fundamental data. Note that our analysis does not factor in the latest price sensitive company announcements.
The author is an independent contributor and at the time of publication had no position in the stocks mentioned.
