Is Northwest Bancshares Inc’s (NWBI) ROE Of 7.43% Sustainable?

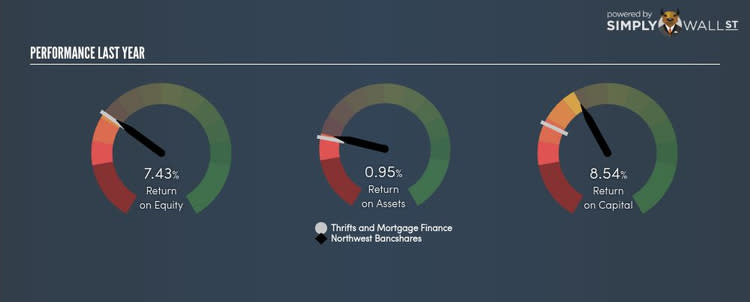
With an ROE of 7.43%, Northwest Bancshares Inc (NASDAQ:NWBI) outpaced its own industry which delivered a less exciting 7.15% over the past year. On the surface, this looks fantastic since we know that NWBI has made large profits from little equity capital; however, ROE doesn’t tell us if management have borrowed heavily to make this happen. Today, we’ll take a closer look at some factors like financial leverage to see how sustainable NWBI’s ROE is. Check out our latest analysis for Northwest Bancshares
Breaking down Return on Equity
Return on Equity (ROE) weighs NWBI’s profit against the level of its shareholders’ equity. An ROE of 7.43% implies $0.07 returned on every $1 invested. In most cases, a higher ROE is preferred; however, there are many other factors we must consider prior to making any investment decisions.
Return on Equity = Net Profit ÷ Shareholders Equity
ROE is assessed against cost of equity, which is measured using the Capital Asset Pricing Model (CAPM) – but let’s not dive into the details of that today. For now, let’s just look at the cost of equity number for NWBI, which is 8.49%. Since NWBI’s return does not cover its cost, with a difference of -1.06%, this means its current use of equity is not efficient and not sustainable. Very simply, NWBI pays more for its capital than what it generates in return. ROE can be split up into three useful ratios: net profit margin, asset turnover, and financial leverage. This is called the Dupont Formula:
Dupont Formula
ROE = profit margin × asset turnover × financial leverage
ROE = (annual net profit ÷ sales) × (sales ÷ assets) × (assets ÷ shareholders’ equity)
ROE = annual net profit ÷ shareholders’ equity
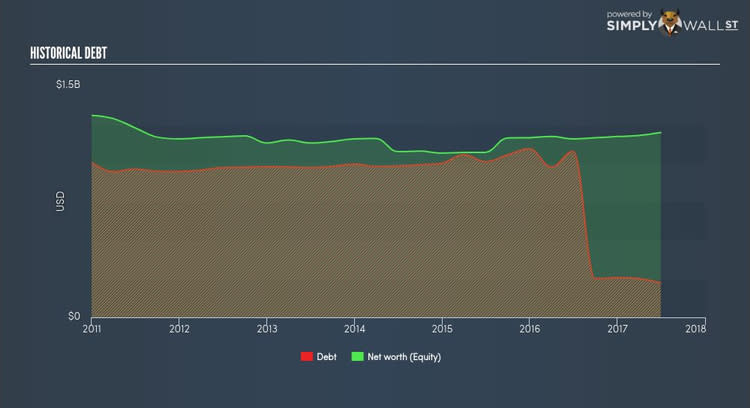
Basically, profit margin measures how much of revenue trickles down into earnings which illustrates how efficient NWBI is with its cost management. The other component, asset turnover, illustrates how much revenue NWBI can make from its asset base. The most interesting ratio, and reflective of sustainability of its ROE, is financial leverage. Since financial leverage can artificially inflate ROE, we need to look at how much debt NWBI currently has. Currently the debt-to-equity ratio stands at a low 18.68%, which means its above-average ROE is driven by its ability to grow its profit without a significant debt burden.
What this means for you:
Are you a shareholder? NWBI exhibits a strong ROE against its peers, however it was not high enough to cover its own cost of equity this year. However, investors shouldn’t despair since ROE is not inflated by excessive debt, which means NWBI still has room to improve shareholder returns by raising debt to fund new investments.
Are you a potential investor? If NWBI has been on your watch list for a while, making an investment decision based on ROE alone is unwise. I recommend you do additional fundamental analysis by looking through our most recent infographic report on Northwest Bancshares to help you make a more informed investment decision. If you are not interested in NWBI anymore, you can use our free platform to see our list of stocks with Return on Equity over 20%.
To help readers see pass the short term volatility of the financial market, we aim to bring you a long-term focused research analysis purely driven by fundamental data. Note that our analysis does not factor in the latest price sensitive company announcements.
The author is an independent contributor and at the time of publication had no position in the stocks mentioned.
