A Note On Power REIT's (NYSEMKT:PW) ROE and Debt To Equity

Many investors are still learning about the various metrics that can be useful when analysing a stock. This article is for those who would like to learn about Return On Equity (ROE). By way of learning-by-doing, we'll look at ROE to gain a better understanding of Power REIT (NYSEMKT:PW).
Our data shows Power REIT has a return on equity of 6.6% for the last year. That means that for every $1 worth of shareholders' equity, it generated $0.066 in profit.
See our latest analysis for Power REIT
How Do You Calculate ROE?
The formula for ROE is:
Return on Equity = Net Profit ÷ Shareholders' Equity
Or for Power REIT:
6.6% = US$541k ÷ US$12m (Based on the trailing twelve months to March 2019.)
It's easy to understand the 'net profit' part of that equation, but 'shareholders' equity' requires further explanation. It is all earnings retained by the company, plus any capital paid in by shareholders. You can calculate shareholders' equity by subtracting the company's total liabilities from its total assets.
What Does Return On Equity Mean?
ROE measures a company's profitability against the profit it retains, and any outside investments. The 'return' is the amount earned after tax over the last twelve months. The higher the ROE, the more profit the company is making. So, all else being equal, a high ROE is better than a low one. That means it can be interesting to compare the ROE of different companies.
Does Power REIT Have A Good ROE?
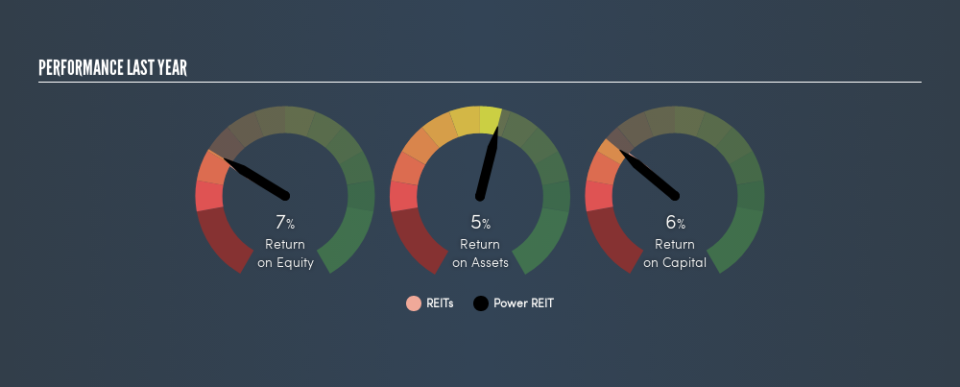
One simple way to determine if a company has a good return on equity is to compare it to the average for its industry. Importantly, this is far from a perfect measure, because companies differ significantly within the same industry classification. You can see in the graphic below that Power REIT has an ROE that is fairly close to the average for the REITs industry (6.1%).
That isn't amazing, but it is respectable. ROE can give us a view about company quality, but many investors also look to other factors, such as whether there are insiders buying shares. I will like Power REIT better if I see some big insider buys. While we wait, check out this free list of growing companies with considerable, recent, insider buying.
Why You Should Consider Debt When Looking At ROE
Companies usually need to invest money to grow their profits. The cash for investment can come from prior year profits (retained earnings), issuing new shares, or borrowing. In the first two cases, the ROE will capture this use of capital to grow. In the latter case, the use of debt will improve the returns, but will not change the equity. In this manner the use of debt will boost ROE, even though the core economics of the business stay the same.
Power REIT's Debt And Its 6.6% ROE
Power REIT has a debt to equity ratio of 0.77, which is far from excessive. Although the ROE isn't overly impressive, the debt load is modest, suggesting the business has potential. Conservative use of debt to boost returns is usually a good move for shareholders, though it does leave the company more exposed to interest rate rises.
The Bottom Line On ROE
Return on equity is one way we can compare the business quality of different companies. Companies that can achieve high returns on equity without too much debt are generally of good quality. If two companies have the same ROE, then I would generally prefer the one with less debt.
But when a business is high quality, the market often bids it up to a price that reflects this. Profit growth rates, versus the expectations reflected in the price of the stock, are a particularly important to consider. You can see how the company has grow in the past by looking at this FREE detailed graph of past earnings, revenue and cash flow.
Of course Power REIT may not be the best stock to buy. So you may wish to see this free collection of other companies that have high ROE and low debt.
We aim to bring you long-term focused research analysis driven by fundamental data. Note that our analysis may not factor in the latest price-sensitive company announcements or qualitative material.
If you spot an error that warrants correction, please contact the editor at editorial-team@simplywallst.com. This article by Simply Wall St is general in nature. It does not constitute a recommendation to buy or sell any stock, and does not take account of your objectives, or your financial situation. Simply Wall St has no position in the stocks mentioned. Thank you for reading.
