NOW Inc (NYSE:DNOW): Has Recent Earnings Growth Beaten Long-Term Trend?

Measuring NOW Inc’s (NYSE:DNOW) track record of past performance is an insightful exercise for investors. It enables us to reflect on whether the company has met or exceed expectations, which is a powerful signal for future performance. Below, I will assess DNOW’s recent performance announced on 30 September 2017 and compare these figures to its historical trend and industry movements. View our latest analysis for NOW
How DNOW fared against its long-term earnings performance and its industry
I prefer to use the ‘latest twelve-month’ data, which annualizes the most recent half-year data, or in some cases, the latest annual report is already the most recent financial year data. This enables me to analyze different companies on a more comparable basis, using the latest information. For NOW, its most recent earnings is -$120.0M, which, relative to last year’s level, has become less negative. Given that these figures are fairly myopic, I’ve estimated an annualized five-year figure for DNOW’s net income, which stands at -$113.5M. This means that, NOW has historically performed better than recently, despite the fact that it seems like earnings are now heading back towards a more favorable position once more.
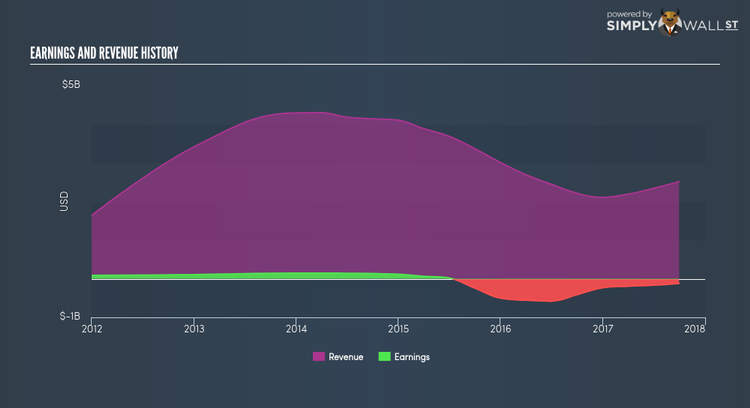
We can further examine NOW’s loss by looking at what’s going on in the industry as well as within the company. Firstly, I want to quickly look into the line items. Revenue growth over the last few years has been negative at -7.20%. The key to profitability here is to make sure the company’s cost growth is well-managed. Viewing growth from a sector-level, the US trade distributors industry has been growing its average earnings by double-digit 19.84% in the prior year, and a more muted 8.24% over the past five. This shows that, despite the fact that NOW is currently running a loss, it may have benefited from industry tailwinds, moving earnings towards to right direction.
What does this mean?
Though NOW’s past data is helpful, it is only one aspect of my investment thesis. With companies that are currently loss-making, it is always difficult to forecast what will occur going forward, and when. The most useful step is to assess company-specific issues NOW may be facing and whether management guidance has steadily been met in the past. I recommend you continue to research NOW to get a better picture of the stock by looking at:
1. Future Outlook: What are well-informed industry analysts predicting for DNOW’s future growth? Take a look at our free research report of analyst consensus for DNOW’s outlook.
2. Financial Health: Is DNOW’s operations financially sustainable? Balance sheets can be hard to analyze, which is why we’ve done it for you. Check out our financial health checks here.
3. Other High-Performing Stocks: Are there other stocks that provide better prospects with proven track records? Explore our free list of these great stocks here.
NB: Figures in this article are calculated using data from the last twelve months, which refer to the 12-month period ending on the last date of the month the financial statement is dated. This may not be consistent with full year annual report figures.
To help readers see pass the short term volatility of the financial market, we aim to bring you a long-term focused research analysis purely driven by fundamental data. Note that our analysis does not factor in the latest price sensitive company announcements.
The author is an independent contributor and at the time of publication had no position in the stocks mentioned.
