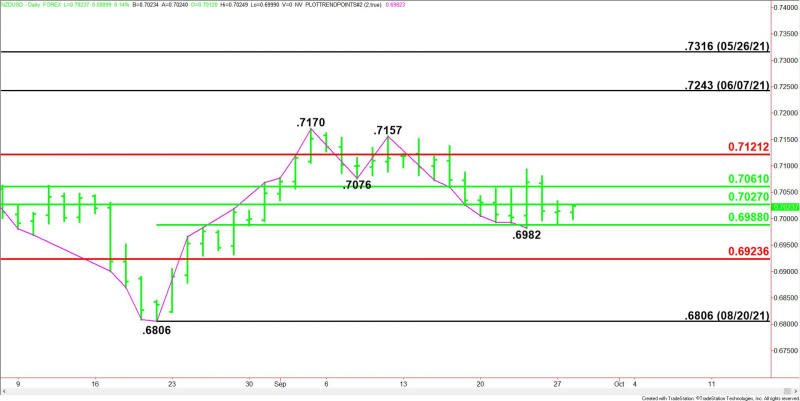
NZD/USD Forex Technical Analysis – Strengthens Over .7027, Weakens Under .6982
The New Zealand Dollar is rangebound for a second session early Tuesday as investors continue to struggle with uncertainty over whether the Reserve Bank of New Zealand (RBNZ) would raise rates at next week’s meeting and the impact of the start of tapering by the U.S. Federal Reserve.
At 04:45 GMT, the NZD/USD is trading .7021, up 0.0007 or +0.11%.
One catalyst keeping a lid on the New Zealand Dollar is rising U.S. Treasury yields. Yields are trading higher early Tuesday after bouncing higher on Monday. The move is a continuation of the momentum created by the Federal Reserve after it indicated last week it was moving closer to easing off its pandemic-era policies.

Daily Swing Chart Technical Analysis
The main trend is down according to the daily swing chart. A trade through .6982 will signal a resumption of the downtrend. A move through .7157 will change the main trend to up. A trade through .7170 will reaffirm the change in trend.
The long-term range is .6589 to .7465. The NZD/USD is currently trying to establish support inside its retracement zone at .7027 to .6924.
The minor range is .6806 to .7170. Its 50% level or pivot at .6988 is support. This level stopped the selling at .6982 on September 23.
The short-term range is .7316 to .6806. Its retracement zone at .7061 to .7121 is resistance.
Daily Swing Chart Technical Forecast
The direction of the NZD/USD on Tuesday is likely to be determined by trader reaction to .6988.
Bullish Scenario
A sustained move over .6988 will indicate the presence of buyers. This could lead to a labored rally with potential targets at .7027, .7061 and .7093. The NZD/USD is likely to struggle on the upside until it breaks out over the Fibonacci level at .7121.
Bearish Scenario
A sustained move under .6988 will signal the presence of sellers. This should lead to a quick test of the minor bottom at .6982. This level is the trigger point for an acceleration into the major Fibonacci level at .6924. Taking out this level could lead to an eventual test of the August 20 main bottom at .6806.
For a look at all of today’s economic events, check out our economic calendar.
This article was originally posted on FX Empire
