NZD/USD Technical Analysis 06.06.2013
NZD/USD Technical Analysis– Prices are testing critical support in the 0.7895-0.7921 region marked by the 61.8% Fibonacci retracement and a rising trend line set from June 2009. A break below that initially exposes the 76.4% level at 0.7743. Near-term resistance is at 0.8065, the 50% retracement, with a push above that eyeing the 0.8181-0.8209 area.
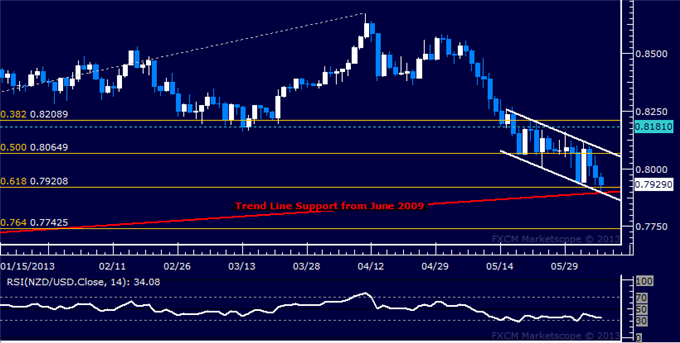
Daily Chart - Created Using FXCM Marketscope 2.0
--- Written by Ilya Spivak, Currency Strategist for Dailyfx.com
To contact Ilya, e-mail ispivak@dailyfx.com. Follow Ilya on Twitter at @IlyaSpivak
To be added to Ilya's e-mail distribution list, please CLICK HERE
New to FX? Watch this Video. For live market updates, visit the Real Time News Feed
DailyFX provides forex news and technical analysis on the trends that influence the global currency markets.
Learn forex trading with a free practice account and trading charts from FXCM.
