NZD/USD Technical Analysis: Standstill Continues Above 0.77
NZD/USD Technical Analysis– Prices are testing support in the 0.7723-57 area marked by a trend line set from August 2010 and the 50% Fibonacci expansion. A break below that initially targets the 61.8% level at 0.7678. Near-term resistance is at 0.7821, the 38.2% Fib. The appearance of a Doji candlestick points to indecision and hints bearish momentum may be ebbing.
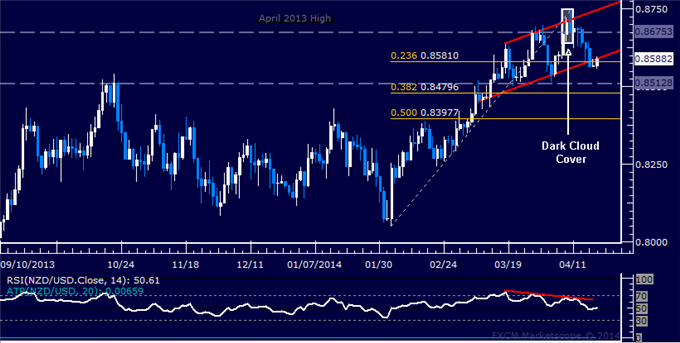
Daily Chart - Created Using FXCM Marketscope 2.0
--- Written by Ilya Spivak, Currency Strategist for Dailyfx.com
To contact Ilya, e-mail ispivak@dailyfx.com. Follow Ilya on Twitter at @IlyaSpivak
To be added to Ilya's e-mail distribution list, please CLICK HERE
New to FX? Watch this Video. For live market updates, visit the Real Time News Feed
DailyFX provides forex news and technical analysis on the trends that influence the global currency markets.
Learn forex trading with a free practice account and trading charts from FXCM.
