What Do Obsidian Energy Ltd (TSE:OBE) Insiders Know That You Don’t?

Obsidian Energy Ltd. explores for, develops, and produces oil and natural gas in western Canada. Obsidian Energy’s insiders have invested more than 5 million shares in the small-cap stocks within the past three months. A well-known argument is that insiders investing more in their own companies’ shares sends an optimistic signal. The MIT Press (1998) published an article showing that stocks following insider buying outperformed the market by 4.5%. However, these signals may not be enough to gain conviction on whether to invest. I will be analysing whether these buying activities are supported by favourable future outlook and recent share price volatility.
View our latest analysis for Obsidian Energy
Which Insiders Are Buying?
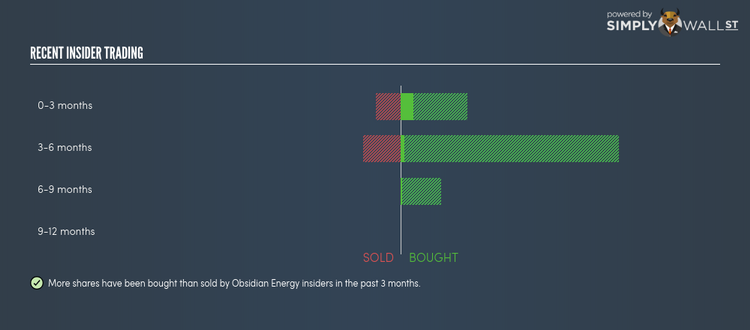
There were more Obsidian Energy insiders that have bought shares than those that have sold. In total, individual insiders own over 37 million shares in the business, which makes up around 7.32% of total shares outstanding. Latest buying activities involved the following insiders: David French , David Lorber (board member) , George Brookman (board member) , Jay Thornton (board member) , John Brydson (board member) , Raymond Crossley (management and board member) and Stephen Loukas .
The entity that bought on the open market in the last three months was
FrontFour Capital Group LLC. Although this is an institutional investor, rather than a company executive or board member, the insights gained from direct access to management as a large investor would make it more well-informed than the average retail investor. In this specific instance, I would classify this investor as a company insider.
Does Buying Activity Reflect Future Growth?
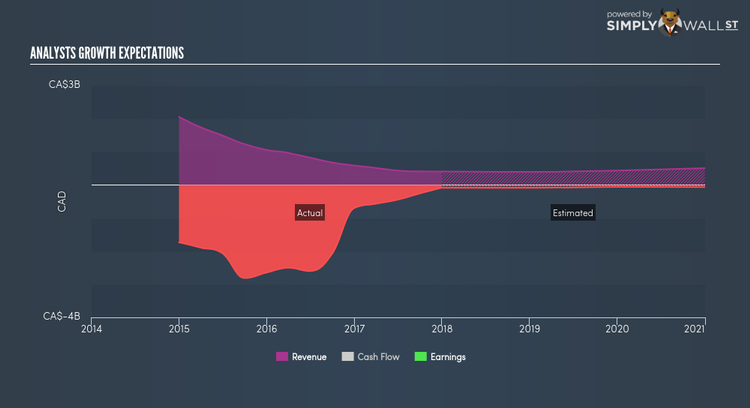
At first glance, analysts’ earnings expectations of 21.94% over the next three years illustrates a positive outlook for the company which is consistent with the signal company insiders are sending with their net buying activity. Digging deeper into the line items,analysts anticipate decline in top-line growth next year, which could imply some headwinds going forward. This is expected to impact the bottom line with a growth of -1.49% next year, indicating cost-cutting may not be significant enough to pull it through into a positive growth region yet. Although, insiders seem to know something the market does not and have been ramping up their holdings in times of uncertainty. This indicates they may see a turnaround or deem the stock to be over-penalized by negative market sentiment.
Did Stock Price Volatility Instigate Buying?
Another factor we should consider is whether the timing of these insider transactions coincide with any significant share price movements. A correlation could mean directors are trading on market inefficiencies based on their belief of the company’s intrinsic value. In the past three months, Obsidian Energy’s share price reached a high of CA$1.52 and a low of CA$1.11. This suggests a relatively high volatility with large change of 36.94%. This movement is potentially meaningful enough to trade on if insiders believe the market has mispriced their companies’ shares.
Next Steps:
Obsidian Energy’s insider meaningful buying activity tells us the shares are currently in favour, though negative growth in expected earnings contests this assumption, while a relatively volatile share price could be the motivation to trade. However, while insider transactions could be a helpful signal, it is definitely not sufficient on its own to make an investment decision. I’ve compiled two essential factors you should look at:
Financial Health: Does Obsidian Energy have a healthy balance sheet? Take a look at our free balance sheet analysis with six simple checks on key factors like leverage and risk.
Other High Quality Alternatives : Are there other high quality stocks you could be holding instead of Obsidian Energy? Explore our interactive list of high quality stocks to get an idea of what else is out there you may be missing!
NB: Figures in this article are calculated using data from the last twelve months, which refer to the 12-month period ending on the last date of the month the financial statement is dated. This may not be consistent with full year annual report figures.
To help readers see pass the short term volatility of the financial market, we aim to bring you a long-term focused research analysis purely driven by fundamental data. Note that our analysis does not factor in the latest price sensitive company announcements.
The author is an independent contributor and at the time of publication had no position in the stocks mentioned.
