Ocean Bio-Chem Inc (NASDAQ:OBCI): Does The -16.46% Earnings Drop Reflect A Longer Term Trend?

For investors with a long-term horizon, assessing earnings trend over time and against industry benchmarks is more valuable than looking at a single earnings announcement in one point in time. Investors may find my commentary, albeit very high-level and brief, on Ocean Bio-Chem Inc (NASDAQ:OBCI) useful as an attempt to give more color around how Ocean Bio-Chem is currently performing. Check out our latest analysis for Ocean Bio-Chem
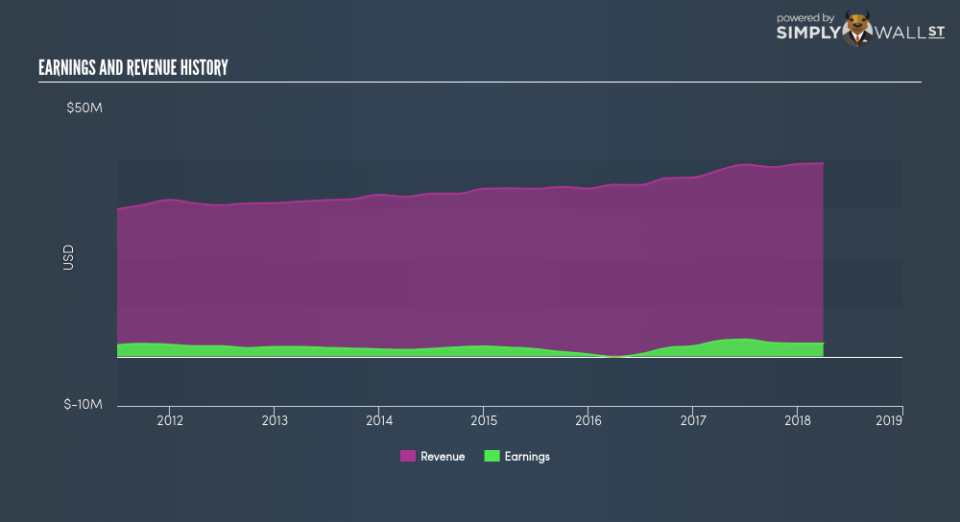
Did OBCI perform worse than its track record and industry?
OBCI’s trailing twelve-month earnings (from 31 March 2018) of US$2.62m has declined by -16.46% compared to the previous year. Furthermore, this one-year growth rate has been lower than its average earnings growth rate over the past 5 years of 1.01%, indicating the rate at which OBCI is growing has slowed down. Why could this be happening? Well, let’s look at what’s going on with margins and if the rest of the industry is feeling the heat.
Revenue growth over the last few years, has been positive, however, earnings growth has failed to keep up meaning Ocean Bio-Chem has been ramping up its expenses by a lot more. This harms margins and earnings, and is not a sustainable practice. Inspecting growth from a sector-level, the US household products industry has been growing its average earnings by double-digit 17.28% in the prior year, and a more muted 8.80% over the last five years. This suggests that any uplift the industry is benefiting from, Ocean Bio-Chem has not been able to gain as much as its industry peers.
In terms of returns from investment, Ocean Bio-Chem has not invested its equity funds well, leading to a 10.55% return on equity (ROE), below the sensible minimum of 20%. Furthermore, its return on assets (ROA) of 7.95% is below the US Household Products industry of 8.19%, indicating Ocean Bio-Chem’s are utilized less efficiently. And finally, its return on capital (ROC), which also accounts for Ocean Bio-Chem’s debt level, has declined over the past 3 years from 13.42% to 12.39%. This correlates with an increase in debt holding, with debt-to-equity ratio rising from 10.96% to 17.14% over the past 5 years.
What does this mean?
Ocean Bio-Chem’s track record can be a valuable insight into its earnings performance, but it certainly doesn’t tell the whole story. Companies that are profitable, but have volatile earnings, can have many factors impacting its business. I suggest you continue to research Ocean Bio-Chem to get a better picture of the stock by looking at:
Future Outlook: What are well-informed industry analysts predicting for OBCI’s future growth? Take a look at our free research report of analyst consensus for OBCI’s outlook.
Financial Health: Is OBCI’s operations financially sustainable? Balance sheets can be hard to analyze, which is why we’ve done it for you. Check out our financial health checks here.
Other High-Performing Stocks: Are there other stocks that provide better prospects with proven track records? Explore our free list of these great stocks here.
NB: Figures in this article are calculated using data from the trailing twelve months from 31 March 2018. This may not be consistent with full year annual report figures.
To help readers see pass the short term volatility of the financial market, we aim to bring you a long-term focused research analysis purely driven by fundamental data. Note that our analysis does not factor in the latest price sensitive company announcements.
The author is an independent contributor and at the time of publication had no position in the stocks mentioned.
