
This One Chart Shows You How Crazy The Current Rally In Small Cap Stocks Has Gotten
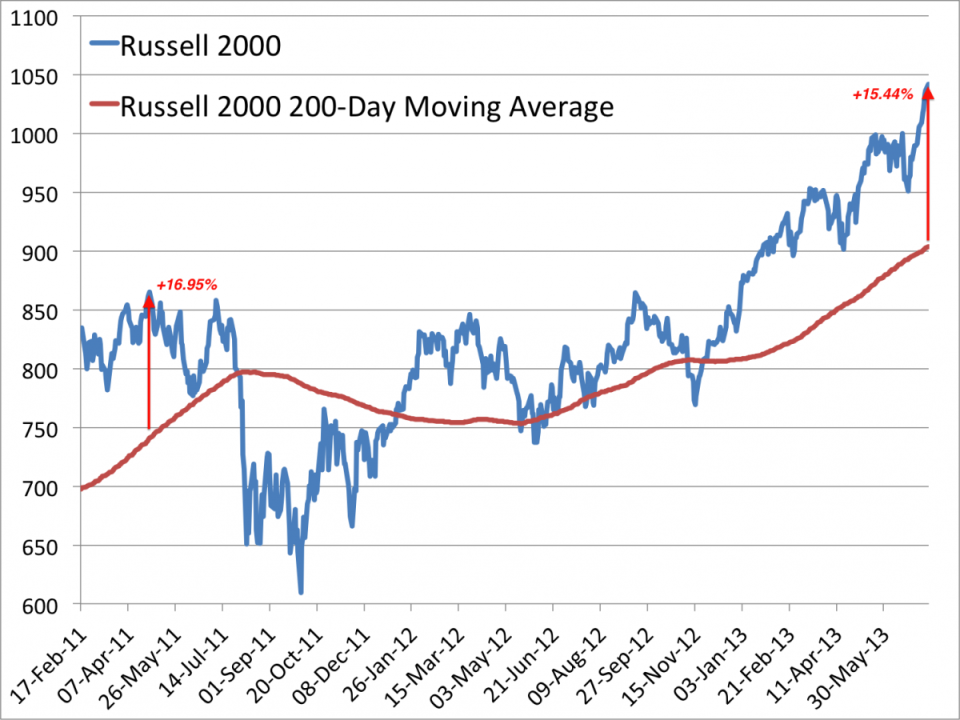
Among the charts getting passed around today is this one: the Russell 2000 and its 200-day moving average.
The chart shows that the index – a proxy for the performance of small-cap stocks – hasn't risen this high above its 200-day moving average since May 2011.
Miller Tabak Chief Technical Market Analyst Jonathan Krinsky points to this chart as a sign that the Russell 2000 is approaching extreme overbought levels:
The small-caps are once again leading first-tier stocks, with the [Russell 2000] up 0.49% to a new all-time high, while the [S&P 500] and [Dow Jones Industrial Average] are up ~0.10%. With that continued outperformance, the index is certainly getting more towards an extreme overbought level. Daily [relative strength index] is 71, which is high but not extreme. The index is nearly 5% above its 20 Day Moving Average, which is the highest in over a year, and is 15% above its 200 DMA, the highest since May 2nd, 2011. For reference, it reached 14.5% on May 20th, 2013, two days prior to the May peak. Of course May 2nd, 2011 was the peak for 2011.
To be clear, overbought conditions, even extreme ones, are not reasons to sell. Especially in trending markets, they can get and stay overbought for extended periods of time. In fact, during the 2011 run, the spread first hit 15% in late March, and the Russell continued to push higher for over a month. We simply want to highlight that the short-term risk/reward is hardly favorable under the current conditions.
Check out the Russell 2000 versus its 200-day moving average below.
Miller Tabak, Business Insider, Bloomberg
More From Business Insider
