Is There An Opportunity With Kelt Exploration Ltd.'s (TSE:KEL) 41% Undervaluation?
Key Insights
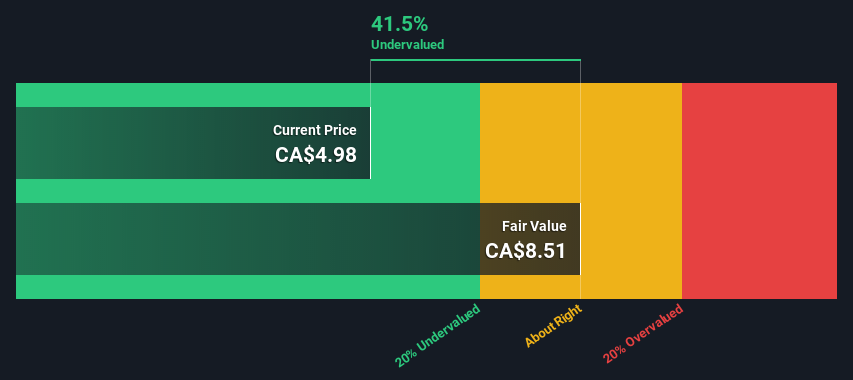
Kelt Exploration's estimated fair value is CA$8.51 based on 2 Stage Free Cash Flow to Equity
Kelt Exploration's CA$4.98 share price signals that it might be 41% undervalued
The CA$7.96 analyst price target for KEL is 6.4% less than our estimate of fair value
Today we'll do a simple run through of a valuation method used to estimate the attractiveness of Kelt Exploration Ltd. (TSE:KEL) as an investment opportunity by taking the forecast future cash flows of the company and discounting them back to today's value. We will use the Discounted Cash Flow (DCF) model on this occasion. Before you think you won't be able to understand it, just read on! It's actually much less complex than you'd imagine.
Remember though, that there are many ways to estimate a company's value, and a DCF is just one method. If you want to learn more about discounted cash flow, the rationale behind this calculation can be read in detail in the Simply Wall St analysis model.
View our latest analysis for Kelt Exploration
Crunching The Numbers
We're using the 2-stage growth model, which simply means we take in account two stages of company's growth. In the initial period the company may have a higher growth rate and the second stage is usually assumed to have a stable growth rate. In the first stage we need to estimate the cash flows to the business over the next ten years. Where possible we use analyst estimates, but when these aren't available we extrapolate the previous free cash flow (FCF) from the last estimate or reported value. We assume companies with shrinking free cash flow will slow their rate of shrinkage, and that companies with growing free cash flow will see their growth rate slow, over this period. We do this to reflect that growth tends to slow more in the early years than it does in later years.
A DCF is all about the idea that a dollar in the future is less valuable than a dollar today, so we need to discount the sum of these future cash flows to arrive at a present value estimate:
10-year free cash flow (FCF) forecast
2023 | 2024 | 2025 | 2026 | 2027 | 2028 | 2029 | 2030 | 2031 | 2032 | |
Levered FCF (CA$, Millions) | CA$2.47m | CA$60.0m | CA$234.0m | CA$185.0m | CA$158.1m | CA$142.8m | CA$133.9m | CA$128.8m | CA$126.0m | CA$124.8m |
Growth Rate Estimate Source | Analyst x3 | Analyst x4 | Analyst x1 | Analyst x1 | Est @ -14.54% | Est @ -9.65% | Est @ -6.23% | Est @ -3.83% | Est @ -2.15% | Est @ -0.98% |
Present Value (CA$, Millions) Discounted @ 8.6% | CA$2.3 | CA$50.9 | CA$183 | CA$133 | CA$105 | CA$87.1 | CA$75.2 | CA$66.6 | CA$60.0 | CA$54.7 |
("Est" = FCF growth rate estimated by Simply Wall St)
Present Value of 10-year Cash Flow (PVCF) = CA$817m
We now need to calculate the Terminal Value, which accounts for all the future cash flows after this ten year period. For a number of reasons a very conservative growth rate is used that cannot exceed that of a country's GDP growth. In this case we have used the 5-year average of the 10-year government bond yield (1.8%) to estimate future growth. In the same way as with the 10-year 'growth' period, we discount future cash flows to today's value, using a cost of equity of 8.6%.
Terminal Value (TV)= FCF2032 × (1 + g) ÷ (r – g) = CA$125m× (1 + 1.8%) ÷ (8.6%– 1.8%) = CA$1.9b
Present Value of Terminal Value (PVTV)= TV / (1 + r)10= CA$1.9b÷ ( 1 + 8.6%)10= CA$816m
The total value, or equity value, is then the sum of the present value of the future cash flows, which in this case is CA$1.6b. In the final step we divide the equity value by the number of shares outstanding. Compared to the current share price of CA$5.0, the company appears quite good value at a 41% discount to where the stock price trades currently. Remember though, that this is just an approximate valuation, and like any complex formula - garbage in, garbage out.
The Assumptions
Now the most important inputs to a discounted cash flow are the discount rate, and of course, the actual cash flows. You don't have to agree with these inputs, I recommend redoing the calculations yourself and playing with them. The DCF also does not consider the possible cyclicality of an industry, or a company's future capital requirements, so it does not give a full picture of a company's potential performance. Given that we are looking at Kelt Exploration as potential shareholders, the cost of equity is used as the discount rate, rather than the cost of capital (or weighted average cost of capital, WACC) which accounts for debt. In this calculation we've used 8.6%, which is based on a levered beta of 1.150. Beta is a measure of a stock's volatility, compared to the market as a whole. We get our beta from the industry average beta of globally comparable companies, with an imposed limit between 0.8 and 2.0, which is a reasonable range for a stable business.
SWOT Analysis for Kelt Exploration
Strength
Earnings growth over the past year exceeded its 5-year average.
Debt is not viewed as a risk.
Weakness
Earnings growth over the past year underperformed the Oil and Gas industry.
Opportunity
Annual revenue is forecast to grow faster than the Canadian market.
Trading below our estimate of fair value by more than 20%.
Significant insider buying over the past 3 months.
Threat
Annual earnings are forecast to decline for the next 2 years.
Moving On:
Although the valuation of a company is important, it is only one of many factors that you need to assess for a company. The DCF model is not a perfect stock valuation tool. Rather it should be seen as a guide to "what assumptions need to be true for this stock to be under/overvalued?" For instance, if the terminal value growth rate is adjusted slightly, it can dramatically alter the overall result. What is the reason for the share price sitting below the intrinsic value? For Kelt Exploration, we've put together three pertinent items you should further examine:
Risks: Be aware that Kelt Exploration is showing 2 warning signs in our investment analysis , you should know about...
Management:Have insiders been ramping up their shares to take advantage of the market's sentiment for KEL's future outlook? Check out our management and board analysis with insights on CEO compensation and governance factors.
Other High Quality Alternatives: Do you like a good all-rounder? Explore our interactive list of high quality stocks to get an idea of what else is out there you may be missing!
PS. Simply Wall St updates its DCF calculation for every Canadian stock every day, so if you want to find the intrinsic value of any other stock just search here.
Have feedback on this article? Concerned about the content? Get in touch with us directly. Alternatively, email editorial-team (at) simplywallst.com.
This article by Simply Wall St is general in nature. We provide commentary based on historical data and analyst forecasts only using an unbiased methodology and our articles are not intended to be financial advice. It does not constitute a recommendation to buy or sell any stock, and does not take account of your objectives, or your financial situation. We aim to bring you long-term focused analysis driven by fundamental data. Note that our analysis may not factor in the latest price-sensitive company announcements or qualitative material. Simply Wall St has no position in any stocks mentioned.
Join A Paid User Research Session
You’ll receive a US$30 Amazon Gift card for 1 hour of your time while helping us build better investing tools for the individual investors like yourself. Sign up here
