Is There An Opportunity With Walgreens Boots Alliance Inc’s (NASDAQ:WBA) 34% Undervaluation?

I am going to run you through how I calculated the intrinsic value of Walgreens Boots Alliance Inc (NASDAQ:WBA) using the discounted cash flow (DCF) method. Anyone interested in learning a bit more about intrinsic value should have a read of the Simply Wall St analysis model. If you are reading this after March 2018 then I highly recommend you check out the latest calculation for Walgreens Boots Alliance here.
Is WBA fairly valued?
I use what is known as the 2-stage model, which takes into account the initial higher growth stage of a company’s life cycle and the steadier growth phase over the long run. To start off, I use the analyst consensus estimates of WBA’s levered free cash flow (FCF) over the next five years and discounted these values at the rate of 8.49%. This resulted in a present value of 5-year cash flow of US$25.75B. Keen to understand how I arrived at this number? Take a look at our detailed analysis here.
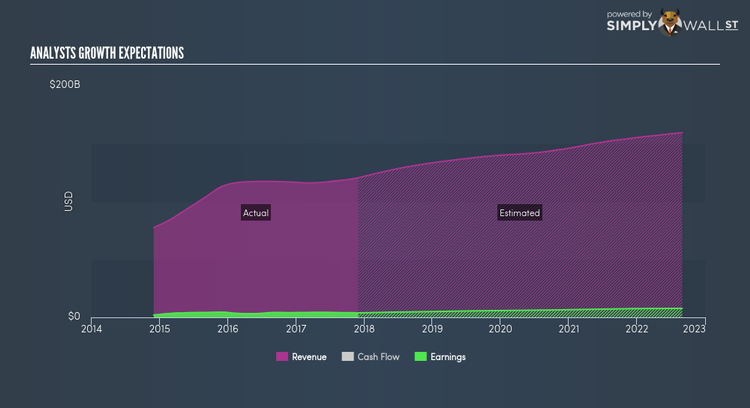
The graph above shows how WBA’s earnings are expected to move going forward, which should give you some color on WBA’s outlook. Next, I determine the terminal value, which is the business’s cash flow after the first stage. It’s appropriate to use the 10-year government bond rate of 2.8% as the stable growth rate, which is rightly below GDP growth, but more towards the conservative side. The present value of the terminal value after discounting it back five years is US$73.55B.
The total value is the sum of cash flows for the next five years and the discounted terminal value, which results in the Total Equity Value, which in this case is US$99.30B. To get the intrinsic value per share, we divide this by the total number of shares outstanding. This results in an intrinsic value of $100.24, which, compared to the current share price of $65.96, we find that Walgreens Boots Alliance is quite good value at a 34.20% discount to what it is available for right now.
Next Steps:
Whilst important, DCF calculation shouldn’t be the only metric you look at when researching a company. What is the reason for the share price to differ from the intrinsic value? For WBA, I’ve put together three fundamental factors you should further research:
Financial Health: Does WBA have a healthy balance sheet? Take a look at our free balance sheet analysis with six simple checks on key factors like leverage and risk.
Future Earnings: How does WBA’s growth rate compare to its peers and the wider market? Dig deeper into the analyst consensus number for the upcoming years by interacting with our free analyst growth expectation chart.
Other High Quality Alternatives: Are there other high quality stocks you could be holding instead of WBA? Explore our interactive list of high quality stocks to get an idea of what else is out there you may be missing!
PS. The Simply Wall St app conducts a discounted cash flow for every stock on the NASDAQ every 6 hours. If you want to find the calculation for other stocks just search here.
To help readers see pass the short term volatility of the financial market, we aim to bring you a long-term focused research analysis purely driven by fundamental data. Note that our analysis does not factor in the latest price sensitive company announcements.
The author is an independent contributor and at the time of publication had no position in the stocks mentioned.
