Orion Engineered Carbons SA (OEC) Delivered A Better ROE Than The Industry, Here’s Why

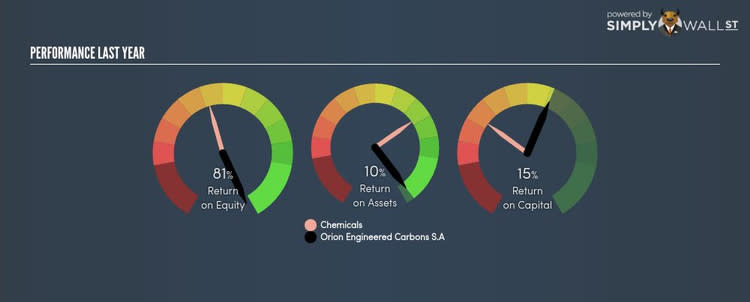
Orion Engineered Carbons SA (NYSE:OEC) delivered an ROE of 81.12% over the past 12 months, which is an impressive feat relative to its industry average of 13.48% during the same period. While the impressive ratio tells us that OEC has made significant profits from little equity capital, ROE doesn’t tell us if OEC has borrowed debt to make this happen. We’ll take a closer look today at factors like financial leverage to determine whether OEC’s ROE is actually sustainable. View our latest analysis for Orion Engineered Carbons S.A
Breaking down ROE — the mother of all ratios
Return on Equity (ROE) weighs OEC’s profit against the level of its shareholders’ equity. For example, if OEC invests $1 in the form of equity, it will generate $0.81 in earnings from this. Generally speaking, a higher ROE is preferred; however, there are other factors we must also consider before making any conclusions.
Return on Equity = Net Profit ÷ Shareholders Equity
Returns are usually compared to costs to measure the efficiency of capital. OEC’s cost of equity is 12.65%. This means OEC returns enough to cover its own cost of equity, with a buffer of 68.47%. This sustainable practice implies that the company pays less for its capital than what it generates in return. ROE can be split up into three useful ratios: net profit margin, asset turnover, and financial leverage. This is called the Dupont Formula:
Dupont Formula
ROE = profit margin × asset turnover × financial leverage
ROE = (annual net profit ÷ sales) × (sales ÷ assets) × (assets ÷ shareholders’ equity)
ROE = annual net profit ÷ shareholders’ equity
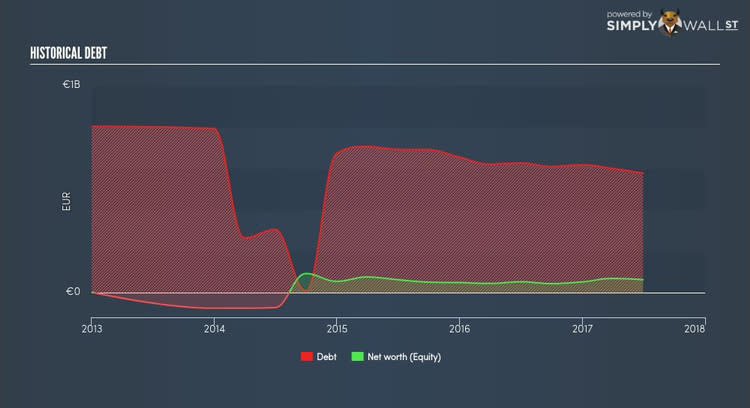
Essentially, profit margin shows how much money the company makes after paying for all its expenses. Asset turnover reveals how much revenue can be generated from OEC’s asset base. The most interesting ratio, and reflective of sustainability of its ROE, is financial leverage. Since ROE can be inflated by excessive debt, we need to examine OEC’s debt-to-equity level. The debt-to-equity ratio currently stands at over 2.5 times, meaning the above-average ratio is a result of a large amount of debt.
What this means for you:
Are you a shareholder? OEC exhibits a strong ROE against its peers, as well as sufficient returns to cover its cost of equity. However, its high debt level appears to be the driver of a strong ROE and is something you should be mindful of before adding more of OEC to your portfolio. If you’re looking for new ideas for high-returning stocks, you should take a look at our free platform to see the list of stocks with Return on Equity over 20%.
Are you a potential investor? If you are considering investing in OEC, basing your decision on ROE alone is certainly not sufficient. I recommend you do additional fundamental analysis by looking through our most recent infographic report on Orion Engineered Carbons S.A to help you make a more informed investment decision.
To help readers see pass the short term volatility of the financial market, we aim to bring you a long-term focused research analysis purely driven by fundamental data. Note that our analysis does not factor in the latest price sensitive company announcements.
The author is an independent contributor and at the time of publication had no position in the stocks mentioned.
