Oritani Financial Corp (NASDAQ:ORIT) Delivered A Better ROE Than The Industry, Here’s Why

This article is intended for those of you who are at the beginning of your investing journey and looking to gauge the potential return on investment in Oritani Financial Corp (NASDAQ:ORIT).
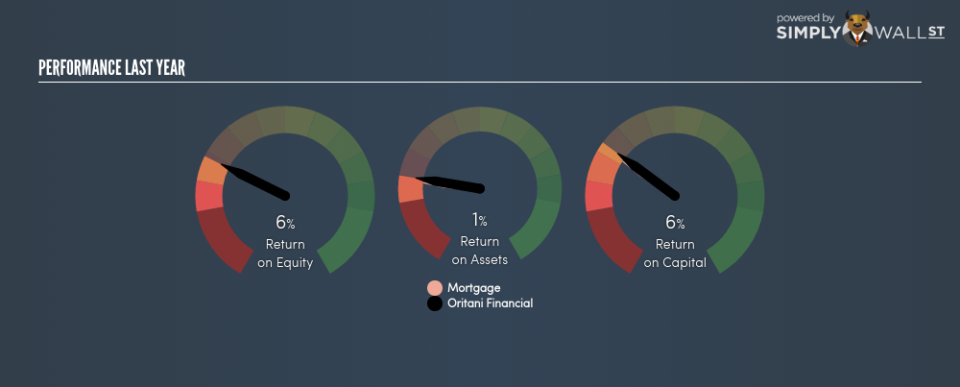
With an ROE of 5.82%, Oritani Financial Corp (NASDAQ:ORIT) outpaced its own industry which delivered a less exciting 5.71% over the past year. Superficially, this looks great since we know that ORIT has generated big profits with little equity capital; however, ROE doesn’t tell us how much ORIT has borrowed in debt. In this article, we’ll closely examine some factors like financial leverage to evaluate the sustainability of ORIT’s ROE. View out our latest analysis for Oritani Financial
Breaking down Return on Equity
Firstly, Return on Equity, or ROE, is simply the percentage of last years’ earning against the book value of shareholders’ equity. For example, if the company invests $1 in the form of equity, it will generate $0.058 in earnings from this. In most cases, a higher ROE is preferred; however, there are many other factors we must consider prior to making any investment decisions.
Return on Equity = Net Profit ÷ Shareholders Equity
ROE is assessed against cost of equity, which is measured using the Capital Asset Pricing Model (CAPM) – but let’s not dive into the details of that today. For now, let’s just look at the cost of equity number for Oritani Financial, which is 9.58%. This means Oritani Financial’s returns actually do not cover its own cost of equity, with a discrepancy of -3.76%. This isn’t sustainable as it implies, very simply, that the company pays more for its capital than what it generates in return. ROE can be split up into three useful ratios: net profit margin, asset turnover, and financial leverage. This is called the Dupont Formula:
Dupont Formula
ROE = profit margin × asset turnover × financial leverage
ROE = (annual net profit ÷ sales) × (sales ÷ assets) × (assets ÷ shareholders’ equity)
ROE = annual net profit ÷ shareholders’ equity
The first component is profit margin, which measures how much of sales is retained after the company pays for all its expenses. Asset turnover reveals how much revenue can be generated from Oritani Financial’s asset base. And finally, financial leverage is simply how much of assets are funded by equity, which exhibits how sustainable the company’s capital structure is. Since ROE can be inflated by excessive debt, we need to examine Oritani Financial’s debt-to-equity level. Currently the debt-to-equity ratio stands at a balanced 95.94%, which means its above-average ROE is driven by its ability to grow its profit without a significant debt burden.

Next Steps:
While ROE is a relatively simple calculation, it can be broken down into different ratios, each telling a different story about the strengths and weaknesses of a company. Oritani Financial’s ROE is impressive relative to the industry average, though its returns were not strong enough to cover its own cost of equity. ROE is not likely to be inflated by excessive debt funding, giving shareholders more conviction in the sustainability of industry-beating returns. Although ROE can be a useful metric, it is only a small part of diligent research.
For Oritani Financial, there are three key factors you should further research:
Financial Health: Does it have a healthy balance sheet? Take a look at our free balance sheet analysis with six simple checks on key factors like leverage and risk.
Future Earnings: How does Oritani Financial’s growth rate compare to its peers and the wider market? Dig deeper into the analyst consensus number for the upcoming years by interacting with our free analyst growth expectation chart.
Other High-Growth Alternatives : Are there other high-growth stocks you could be holding instead of Oritani Financial? Explore our interactive list of stocks with large growth potential to get an idea of what else is out there you may be missing!
To help readers see pass the short term volatility of the financial market, we aim to bring you a long-term focused research analysis purely driven by fundamental data. Note that our analysis does not factor in the latest price sensitive company announcements.
The author is an independent contributor and at the time of publication had no position in the stocks mentioned.
