Osisko Development Announces Mineral Resource Estimate for San Antonio Property, Sonora State, Mexico

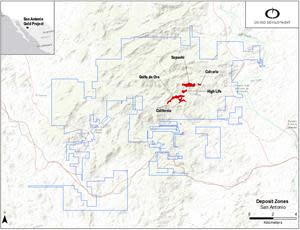
Figure 1: San Antonio Mineral Zones overview map
576,000 oz of Au and 1.37 M oz Ag Indicated and
544,000 oz Au and 1.76 M oz of Ag Inferred
MONTREAL, June 30, 2022 (GLOBE NEWSWIRE) -- Osisko Development Corp. (“Osisko Development” or the “Company”) (ODV TSX.V & NYSE) is pleased to announce an initial open pit resource estimate for the Sapuchi, Golfo de Oro, California, High Life and Calvario Deposits at its San Antonio Project (“San Antonio” or the “Project”) in Sonora State, Mexico.
San Antonio Project Mineral Resource
Indicated Mineral Resource of 576,000 ounces of gold and 1.37 million ounces of silver (14.9 million tonnes grading 1.2 g/t Au and 2.9 g/t Ag).
Inferred Mineral Resource of 544,000 ounces of gold and 1.76 million ounces of silver (16.6 million tonnes grading 1.0 g/t Au and 3.3 g/t Ag).
Mineral resource comprises oxide, transition and sulphide zones for each deposit using 0.27 g/t Au cut-off grade for oxide and 0.44 g/t Au cut-off grade for transition and sulphide and a 50-degree pit slope.
The 2022 Mineral Resource Estimate (“MRE”) covers a portion of the Sapuchi – Cero Verde trend that encompasses five deposits: Sapuchi, Golfo de Oro, California, Calvario and High Life over approximately 2.8 km along strike, a maximum width of 600 metres (m) to a maximum depth of 300 m below surface.
The MRE is based on 84,454 m of current and verified historic drilling in 579 holes, of which 27,870 m of drilling in 177 holes were drilled by the Company in 2021.
Gold mineralization is hosted within altered hydrothermal breccia and sediments, as stockwork quartz veins and veinlets, adjacent to intrusions and fault structures and often associated with iron carbonate minerals.
Resource summary and sensitivity tables are presented in the tables below.
The MRE incorporates five deposits, Sapuchi, California, Golfo de Oro, High Life and Calvario, as part of what comprises 2.8 km of the 10.0 km within the Sapuchi-Cero Verde trend of the San Antonio Project (Figure 1). The deposits are in the indicated and inferred categories listed in Table 1 and a further breakdown by deposit and oxide zone are listed in the Tables 2 and 4. Grade sensitivity is presented in Table 3. Potential mining scenarios indicate a strip ratio of 1.0 to 6.7. The MRE was conducted by Talisker Exploration Services Inc., under the supervision of Servicios Geológicos IMEx, S.C and Micon International Limited.
The deposits are constrained within a geologic model of the hydrothermal breccia, the main mineralization control known to date. Additional drill targets remain underexplored on the property and new exploration drilling is recommended to verify historic data and potentially add new resource. Further infill and exploration drilling is recommended on the Project.
Operational Update
The San Antonio Project gold mineralization is characterized by hydrothermal breccia that forms an approximately 3,000 m long east-northeast trending mineralization corridor with the Luz del Cobre copper deposit at the east. The gold mineralization is associated with intense chlorite and carbonate alteration and is intrusion related with host sedimentary rocks. The breccia has been defined to a vertical depth of 500 m and at an average depth of 250 m. Drilling has occurred within the three major zones at Sapuchi, Golfo de Oro and California, over a combined strike length of 1 km of the 3 km breccia trend.
Since Osisko Development’s acquisition of the San Antonio Project in November 2020, the Company has successfully achieved the following operational milestones
The construction of a leach pad and carbon in column plant at the end of 2021 to process stockpiled mineralized material.
The stockpile has a total of 1.1 M tonnes with an average grade of 0.57 g/t Au.
The processing of the stockpile began in Q4 2021 and currently, 680,000 tonnes of mineralized material has been placed and processed.
Chris Lodder, President of Osisko Development commented, “The addition of this new resource further strengthens our portfolio for near term advancement and towards possible production. Osisko Development has made considerable progress at San Antonio in the past year with the construction of the leach pad, near term processing of the stockpile and completion of a drill program to generate this initial resource. The Company believes there is potential to add to the mineral resource through continued exploration and drilling on the property.”
Table 1: 2022 San Antonio Project Mineral Resource Estimate for an open pit scenario- all deposits indicated category
INDICATED | ||||||
Deposit | Weathering | Tonnes | Au | Ag | Au | Ag |
California | Oxide | 0.6 | 0.93 | 2.8 | 17 | 0.05 |
Transition | 0.2 | 0.79 | 3.3 | 6 | 0.02 | |
Sulphide | 3.1 | 1.31 | 2.4 | 130 | 0.23 | |
Total | 3.9 | 1.22 | 2.5 | 153 | 0.31 | |
Golfo de Oro | Oxide | 0.2 | 1.07 | 2.8 | 7 | 0.02 |
Transition | 0.1 | 1.19 | 2.8 | 6 | 0.01 | |
Sulphide | 5.3 | 1.46 | 2.5 | 249 | 0.42 | |
Total | 5.7 | 1.44 | 2.5 | 262 | 0.46 | |
Sapuchi | Oxide | 1.9 | 0.85 | 3.6 | 53 | 0.22 |
Transition | 1.4 | 1.04 | 3.6 | 47 | 0.16 | |
Sulphide | 2.1 | 0.94 | 3.4 | 62 | 0.22 | |
Total | 5.4 | 0.93 | 3.5 | 162 | 0.61 | |
Total | Oxide | 2.7 | 0.89 | 3.4 | 77 | 0.30 |
Transition | 1.8 | 1.02 | 3.5 | 59 | 0.20 | |
Sulphide | 10.4 | 1.31 | 2.6 | 441 | 0.88 | |
Total | 14.9 | 1.20 | 2.9 | 576 | 1.37 | |
Table 2: 2022 San Antonio Project Mineral Resource Estimate for an open pit scenario- all deposits inferred category
INFERRED | ||||||
Deposit | Weathering | Tonnes | Au | Ag | Au | Ag |
California | Oxide | 0.4 | 0.68 | 2.1 | 8 | 0.02 |
Transition | 0.1 | 0.85 | 2.6 | 4 | 0.01 | |
Sulphide | 1.1 | 1.27 | 3.8 | 46 | 0.14 | |
Total | 1.6 | 1.10 | 3.3 | 58 | 0.17 | |
Golfo de Oro | Oxide | 0.5 | 0.80 | 3.0 | 12 | 0.04 |
Transition | 0.2 | 0.93 | 3.4 | 5 | 0.02 | |
Sulphide | 5.7 | 1.29 | 2.5 | 237 | 0.46 | |
Total | 6.4 | 1.24 | 2.5 | 254 | 0.52 | |
High Life | Oxide | 0.5 | 0.84 | 4.2 | 14 | 0.07 |
Transition | 0.2 | 0.73 | 4.5 | 4 | 0.02 | |
Sulphide | 0.1 | 0.90 | 8.3 | 4 | 0.04 | |
Total | 0.8 | 0.83 | 4.9 | 22 | 0.13 | |
Sapuchi | Oxide | 3.2 | 0.74 | 3.7 | 75 | 0.37 |
Transition | 1.6 | 0.92 | 3.6 | 48 | 0.19 | |
Sulphide | 2.8 | 0.92 | 4.1 | 84 | 0.37 | |
Total | 7.6 | 0.85 | 3.8 | 208 | 0.94 | |
Calvario | Oxide | 0.1 | 0.53 | 0.0 | 2 | 0.00 |
Transition | 0.0 | 0.55 | 0.0 | 0.0 | 0.00 | |
Sulphide | 0.0 | 0.0 | 0.0 | 0.0 | 0.00 | |
Total | 0.1 | 0.53 | 0.0 | 2 | 0.00 | |
Total | Oxide | 4.6 | 0.74 | 3.5 | 111 | 0.51 |
Transition | 2.1 | 0.90 | 3.6 | 61 | 0.24 | |
Sulphide | 9.8 | 1.18 | 3.2 | 371 | 1.00 | |
Total | 16.6 | 1.02 | 3.3 | 544 | 1.76 | |
Table 3: San Antonio Project Mineral Resource Estimate for an open pit scenario, all deposits separated by oxide zone.
Category | Zone | Tonnes | Au | Ag | Au | Ag |
Indicated | Oxide | 2.7 | 0.89 | 3.4 | 77 | 0.30 |
Transition | 1.8 | 1.02 | 3.5 | 59 | 0.20 | |
Sulphide | 10.4 | 1.31 | 2.6 | 441 | 0.88 | |
Total | 14.9 | 1.20 | 2.9 | 576 | 1.37 | |
Inferred | Oxide | 4.6 | 0.74 | 3.5 | 111 | 0.51 |
Transition | 2.1 | 0.90 | 3.6 | 61 | 0.24 | |
Sulphide | 9.8 | 1.18 | 3.2 | 371 | 1.00 | |
Total | 16.6 | 1.02 | 3.3 | 544 | 1.76 |
Table 4: San Antonio Project Cut-Off Gold Price Sensitivity Table (Base cases in Bold), Indicated Category
Sensitivity to Gold Price INDICATED | |||||||
Gold | Cut-off | Weathering | Tonnes | Au | Ag | Au | Ag |
1400 | 0.34 | Oxide | 2.6 | 0.90 | 3.4 | 76 | 0.29 |
0.55 | Transition | 1.6 | 1.07 | 3.6 | 55 | 0.18 | |
0.55 | Sulphide | 8.0 | 1.44 | 2.8 | 372 | 0.72 | |
| Total | 12.3 | 1.28 | 3.0 | 504 | 1.19 | |
1450 | 0.33 | Oxide | 2.6 | 0.90 | 3.4 | 76 | 0.29 |
0.54 | Transition | 1.6 | 1.06 | 3.5 | 56 | 0.19 | |
0.54 | Sulphide | 8.2 | 1.43 | 2.8 | 377 | 0.73 | |
| Total | 12.5 | 1.27 | 3.0 | 510 | 1.21 | |
1500 | 0.32 | Oxide | 2.7 | 0.90 | 3.4 | 77 | 0.29 |
0.52 | Transition | 1.7 | 1.05 | 3.5 | 57 | 0.19 | |
0.52 | Sulphide | 9.0 | 1.40 | 2.7 | 404 | 0.78 | |
| Total | 13.3 | 1.25 | 3.0 | 537 | 1.27 | |
1550 | 0.31 | Oxide | 2.7 | 0.89 | 3.4 | 77 | 0.29 |
0.50 | Transition | 1.7 | 1.05 | 3.5 | 57 | 0.19 | |
0.50 | Sulphide | 9.3 | 1.38 | 2.7 | 411 | 0.80 | |
| Total | 13.6 | 1.24 | 2.9 | 545 | 1.29 | |
1600 | 0.30 | Oxide | 2.7 | 0.89 | 3.4 | 77 | 0.29 |
0.48 | Transition | 1.7 | 1.04 | 3.5 | 58 | 0.20 | |
0.48 | Sulphide | 9.6 | 1.37 | 2.7 | 420 | 0.83 | |
| Total | 14.0 | 1.23 | 2.9 | 554 | 1.31 | |
1650 | 0.29 | Oxide | 2.7 | 0.89 | 3.4 | 77 | 0.29 |
0.47 | Transition | 1.8 | 1.03 | 3.5 | 58 | 0.20 | |
0.47 | Sulphide | 9.8 | 1.35 | 2.7 | 426 | 0.84 | |
| Total | 14.3 | 1.22 | 2.9 | 561 | 1.33 | |
1700 | 0.28 | Oxide | 2.7 | 0.89 | 3.4 | 77 | 0.29 |
0.46 | Transition | 1.8 | 1.02 | 3.5 | 58 | 0.20 | |
0.46 | Sulphide | 10.1 | 1.33 | 2.6 | 432 | 0.86 | |
| Total | 14.5 | 1.21 | 2.9 | 567 | 1.35 | |
1750 | 0.27 | Oxide | 2.7 | 0.89 | 3.4 | 77 | 0.30 |
0.44 | Transition | 1.8 | 1.02 | 3.5 | 59 | 0.20 | |
0.44 | Sulphide | 10.4 | 1.31 | 2.6 | 441 | 0.88 | |
| Total | 14.9 | 1.20 | 2.9 | 576 | 1.37 | |
1800 | 0.27 | Oxide | 2.7 | 0.89 | 3.4 | 77 | 0.30 |
0.43 | Transition | 1.8 | 1.02 | 3.5 | 59 | 0.20 | |
0.43 | Sulphide | 10.6 | 1.30 | 2.6 | 446 | 0.89 | |
| Total | 15.1 | 1.20 | 2.9 | 582 | 1.39 | |
1850 | 0.26 | Oxide | 2.7 | 0.89 | 3.4 | 77 | 0.30 |
0.42 | Transition | 1.8 | 1.01 | 3.5 | 59 | 0.20 | |
0.42 | Sulphide | 10.9 | 1.30 | 2.6 | 455 | 0.91 | |
| Total | 15.4 | 1.19 | 2.8 | 591 | 1.41 | |
1900 | 0.25 | Oxide | 2.7 | 0.89 | 3.4 | 77 | 0.30 |
0.41 | Transition | 1.8 | 1.01 | 3.5 | 59 | 0.20 | |
0.41 | Sulphide | 11.0 | 1.29 | 2.6 | 457 | 0.92 | |
| Total | 15.6 | 1.18 | 2.8 | 593 | 1.42 | |
Table 5: San Antonio Project Cut-Off Gold Price Sensitivity Table (Base cases in Bold), Inferred Category
Sensitivity to Gold Price INFERRED | |||||||
Gold | Cut-off | Weathering | Tonnes | Au | Ag | Au | Ag |
1400 | 0.34 | Oxide | 3.9 | 0.81 | 3.7 | 103 | 0.47 |
0.55 | Transition | 1.6 | 1.00 | 3.9 | 52 | 0.20 | |
0.55 | Sulphide | 5.9 | 1.38 | 3.5 | 261 | 0.67 | |
| Total | 11.4 | 1.13 | 3.6 | 416 | 1.34 | |
1450 | 0.33 | Oxide | 4.1 | 0.79 | 3.7 | 104 | 0.48 |
0.54 | Transition | 1.7 | 0.98 | 3.8 | 54 | 0.21 | |
0.54 | Sulphide | 6.7 | 1.33 | 3.5 | 286 | 0.75 | |
| Total | 12.5 | 1.11 | 3.6 | 444 | 1.44 | |
1500 | 0.32 | Oxide | 4.2 | 0.78 | 3.6 | 105 | 0.48 |
0.52 | Transition | 1.8 | 0.96 | 3.7 | 56 | 0.22 | |
0.52 | Sulphide | 7.6 | 1.29 | 3.4 | 314 | 0.83 | |
| Total | 13.6 | 1.09 | 3.5 | 475 | 1.53 | |
1550 | 0.31 | Oxide | 4.3 | 0.77 | 3.6 | 107 | 0.49 |
0.50 | Transition | 1.9 | 0.94 | 3.7 | 58 | 0.23 | |
0.50 | Sulphide | 8.1 | 1.26 | 3.3 | 330 | 0.87 | |
| Total | 14.3 | 1.07 | 3.5 | 494 | 1.59 | |
1600 | 0.30 | Oxide | 4.4 | 0.76 | 3.5 | 109 | 0.50 |
0.48 | Transition | 2.0 | 0.93 | 3.7 | 59 | 0.23 | |
0.48 | Sulphide | 8.5 | 1.24 | 3.3 | 339 | 0.90 | |
| Total | 14.9 | 1.06 | 3.4 | 506 | 1.63 | |
1650 | 0.29 | Oxide | 4.5 | 0.76 | 3.5 | 110 | 0.50 |
0.47 | Transition | 2.0 | 0.93 | 3.7 | 59 | 0.23 | |
0.47 | Sulphide | 8.9 | 1.22 | 3.3 | 348 | 0.93 | |
| Total | 15.4 | 1.10 | 3.3 | 517 | 1.67 | |
1700 | 0.28 | Oxide | 4.6 | 0.75 | 3.4 | 111 | 0.51 |
0.46 | Transition | 2.0 | 0.91 | 3.6 | 60 | 0.24 | |
0.46 | Sulphide | 9.3 | 1.20 | 3.2 | 360 | 0.97 | |
| Total | 16.0 | 1.03 | 3.3 | 531 | 1.72 | |
1750 | 0.27 | Oxide | 4.6 | 0.74 | 3.4 | 111 | 0.51 |
0.44 | Transition | 2.1 | 0.90 | 3.6 | 61 | 0.24 | |
0.44 | Sulphide | 9.8 | 1.18 | 3.2 | 371 | 1.00 | |
| Total | 16.6 | 1.02 | 3.3 | 544 | 1.76 | |
1800 | 0.27 | Oxide | 4.8 | 0.73 | 3.3 | 114 | 0.52 |
0.43 | Transition | 2.2 | 0.89 | 3.6 | 62 | 0.25 | |
0.43 | Sulphide | 10.4 | 1.15 | 3.1 | 386 | 1.04 | |
| Total | 17.4 | 1.00 | 3.2 | 562 | 1.81 | |
1850 | 0.26 | Oxide | 4.9 | 0.73 | 3.3 | 114 | 0.52 |
0.42 | Transition | 2.2 | 0.89 | 3.5 | 63 | 0.25 | |
0.42 | Sulphide | 10.9 | 1.13 | 3.1 | 395 | 1.07 | |
| Total | 18.0 | 0.99 | 3.2 | 572 | 1.85 | |
1900 | 0.25 | Oxide | 5.0 | 0.72 | 3.3 | 115 | 0.52 |
0.41 | Transition | 2.3 | 0.88 | 3.5 | 64 | 0.26 | |
0.41 | Sulphide | 11.2 | 1.12 | 3.0 | 404 | 1.09 | |
| Total | 18.4 | 0.99 | 3.2 | 583 | 1.87 | |
Mineral Resource Estimate Notes (For Tables 1, 2 and 3):
Rodrigo Calles, of Servicios Geológicos IMEx, S.C., William Lewis and Alan S J San Martin, of Micon International Limited have reviewed and validated the mineral resource estimate for Sapuchi, Golfo de Oro, California, High Life and Calvario deposits. All are independent “Qualified Persons” (as defined in NI 43-101) responsible for the 2022 MRE. The effective date of the mineral resource estimate is June 24th, 2022.
Specific extraction methods are used only to establish reasonable cut-off grades for various portions of the deposit. No Preliminary Economic Analysis, Pre-Feasibility Study or Feasibility Study has been completed to support economic viability and technical feasibility of exploiting any portion of the mineral resource, by any particular mining method.
The mineral resources disclosed in this press release were estimated using the Canadian Institute of Mining, Metallurgy and Petroleum (“CIM”) standards on mineral resources and reserves definitions, and guidelines prepared by the CIM standing committee on reserve definitions and adopted by the CIM council.
The calculated economic cut-off grade for the resource in: Oxides (70% recovery) is 0.27 g/t Au, Transition and sulphides (90% recovery) is 0.44 g/t Au
Mineral resources are not mineral reserves and do not have demonstrated economic viability.
Geologic modeling was completed by Osisko Development geologist Gilberto Moreno. The MRE was completed by Geologist Leonardo Souza, MAusIMM (CP) of Talisker Exploration Services, under the supervision of Rodrigo Calles, of Servicios Geológicos IMEx, S.C., William Lewis and Alan S. J. San Martin, of Micon International Limited
The estimate is reported for a potential open pit scenario and with USD assumptions. The cut-off grades were calculated using a gold price of $1,750 per ounce, a CAD:USD exchange rate of 1.3; mining cost of $2.95/t; processing cost of $4/t for oxides and $13.0/t for transition and sulphides; and general and administration costs of $2.50/t. The cut-off grades should be re-evaluated in light of future prevailing market conditions (metal prices, exchange rate, mining cost, etc.).
A density of 2.55 g/cm3 was established for all oxide zones, 2.69 g/cm3 for transition zones and 2.74g/cm3 for the sulphide zones.
Resources for Sapuchi, Golfo de Oro, California, High Life and Calvario were estimated using Datamine Studio RM 1.3 software using hard boundaries on composited assays (3.0 m for all zones). Ordinary Kriging interpolation method was used in a with a parent block size = 10m x 10m x 5m.
Results are presented in-situ. Ounce (troy) = metric tons x grade / 31.10348. Calculations used metric units (metres, tonnes, g/t). The number of metric tons was rounded to the nearest thousand. Any discrepancies in the totals are due to rounding effects; rounding followed the recommendations as per NI 43-101;
Neither the Company, Servicios Geológicos IMEx, S.C., nor Micon International Limited. is aware of any known environmental, permitting, legal, title-related, taxation, socio-political, marketing or other relevant issue that could materially affect the mineral resource estimate other than disclosed in this press release.
Gold Price Sensitivity Notes (For Tables 4 and 5):
William Lewis of Micon International Limited has reviewed and validated the gold price sensitivities for the various mineralization types and it is the opinion of the QP that they meet the test of reasonable prospects of economic extraction. Mr. Lewis is an independent “Qualified Person” (as defined in NI 43-101).
Table 6: San Antonio Project Mineral Resource Estimate in pit resources for oxide and transition only.
TOTAL BY OXIDE AND OXIDE + TRANSITION | |||||||
Oxidation Zone | Category | Tonnes (Mt) | Au (g/t) | Ag (g/t) | Au Ounces (‘000) | Ag Ounces (‘000,000) | Strip Ratio |
Oxide Only | Indicated | 2.6 | 0.9 | 3.4 | 75 | 0.3 | 1.0 |
Inferred | 4.2 | 0.8 | 3.4 | 104 | 0.5 | ||
| |||||||
Oxide + Transition | Indicated | 4.2 | 1.0 | 3.5 | 131 | 0.5 | 1.1 |
Inferred | 5.9 | 0.8 | 3.5 | 157 | 0.7 | ||
Mineral Resource Estimate Notes (For Table 6):
The same notes for Tables 1 through 3 are applicable for Table 6. However, two separate pit scenarios were run: 1) A pit using just the oxide material and 2) a pit run using the oxide and transition material. These separate runs resulted in slightly different oxide and transition resources than those that resulted from using the ultimate pit where all three mineralization types were used.
In accordance with National Instrument 43-101 – Standards of Disclosure for Mineral Projects (“NI 43-101”), a Technical Report for the San Antonio Project will be filed on SEDAR and the Company’s website within 45 calendar days of this disclosure.
Qualified Persons and 43-101 Disclosure
Per NI 43-101, Maggie Layman, P.Geo. Vice President Exploration of Osisko Development Corp., is a Qualified Person and has prepared, validated, and approved the technical and scientific content of this news release.
The Independent and Qualified Persons for the Mineral Resources Estimate update, as defined by NI 43-101, is Rodrigo Calles, P.Geo of Servicios Geológicos IMEx and William Lewis, P.Geo of Micon International Limited. and confirm having reviewed this press release and that the scientific and technical information is consistent.
About Osisko Development Corp.
Osisko Development Corp. is uniquely positioned as a premier gold development company in North America to advance the Cariboo Gold Project and other properties in the USA and Mexico, with the objective of becoming the next mid-tier gold producer. The Cariboo Gold Project, located in central British Columbia, Canada, is Osisko Development's flagship asset. The considerable exploration potential at depth and along strike distinguishes the Cariboo Gold Project relative to other development assets. Osisko Development's project pipeline is complemented by its interest in the San Antonio gold project, located in Sonora, Mexico and the Trixie gold test mine, located in Utah, U.S.A.
For further information, please contact Osisko Development Corp.: | |
Jean Francois Lemonde |
|
Cautionary Statements Regarding Estimates of Mineral Resources
This news release uses the terms indicated and inferred mineral resources as a relative measure of the level of confidence in the resource estimate. Readers are cautioned that mineral resources are not mineral reserves and that the economic viability of resources that are not mineral reserves has not been demonstrated. The mineral resource estimate disclosed in this news release may be materially affected by geology, environmental, permitting, legal, title, socio-political, marketing or other relevant issues. The mineral resource estimate is classified in accordance with the Canadian Institute of Mining, Metallurgy and Petroleum’s “CIM Definition Standards on Mineral Resources and Mineral Reserves” incorporated by reference into NI 43-101. Under NI 43-101, estimates of inferred mineral resources may not form the basis of feasibility or pre-feasibility studies or economic studies except for preliminary economic assessments. Readers are cautioned not to assume that further work on the stated resources will lead to mineral reserves that can be mined economically.
Forward-looking Statements
Certain statements contained in this news release may be deemed "forward-looking statements" within the meaning of the United States Private Securities Litigation Reform Act of 1995 and "forward-looking information" within the meaning of applicable Canadian securities legislation. These forward‐looking statements, by their nature, require Osisko Development to make certain assumptions and necessarily involve known and unknown risks and uncertainties that could cause actual results to differ materially from those expressed or implied in these forward‐looking statements. Forward‐looking statements are not guarantees of performance. Words such as "may", "will", "would", "could", "expect", "believe", "plan", "anticipate", "intend", "estimate", "continue", or the negative or comparable terminology, as well as terms usually used in the future and the conditional, are intended to identify forward‐looking statements. Information contained in forward‐looking statements is based upon certain material assumptions that were applied in drawing a conclusion or making a forecast or projection, including management's perceptions of historical trends, current conditions and expected future developments, results of further exploration work to define and expand mineral resources, as well as other considerations that are believed to be appropriate in the circumstances, and any other information herein that is not a historical fact may be "forward looking information". Material assumptions also include, management's perceptions of historical trends, current conditions and expected future developments, results of further exploration work to define or expand any mineral resources, as well as other considerations that are believed to be appropriate in the circumstances. Osisko Development considers its assumptions to be reasonable based on information currently available, but cautions the reader that their assumptions regarding future events, many of which are beyond the control of Osisko Development, may ultimately prove to be incorrect since they are subject to risks and uncertainties that affect Osisko Development and its business. Such risks and uncertainties include, among others, risks relating to capital market conditions, the ability to continue current production, regulatory framework, the ability of exploration activities (including drill results) to accurately predict mineralization; errors in management's geological modelling; the ability of to complete further exploration activities, including drilling; property and stream interests in the Project; the ability of the Company to obtain required approvals; the results of exploration activities; risks relating to exploration, development and mining activities; the global economic climate; metal prices; dilution; environmental risks; and community and non-governmental actions and the responses of relevant governments to the COVID-19 outbreak and the effectiveness of such responses. Readers are urged to consult the disclosure provided under the heading "Risk Factors" in the Company's annual information form for the year ended December 31, 2021, as amended, which has been filed on SEDAR (www.sedar.com) under Osisko Development's issuer profile and on the SEC's EDGAR website (www.sec.gov), for further information regarding the risks and other factors applicable to the exploration results. Although the Company's believes the expectations conveyed by the forward-looking statements are reasonable based on information available at the date of preparation, no assurances can be given as to future results, levels of activity and achievements. The Company disclaims any obligation to update any forward-looking statements, whether as a result of new information, future events or results or otherwise, except as required by law. There can be no assurance that these forward-looking statements will prove to be accurate, as actual results and future events could differ materially from those anticipated in such statements. Accordingly, readers should not place undue reliance on forward-looking statements.
Neither the TSX Venture Exchange nor its Regulation Services Provider (as that term is defined in the policies of the TSX Venture Exchange) accepts responsibility for the adequacy or accuracy of this news release. No stock exchange, securities commission or other regulatory authority has approved or disapproved the information contained herein.
Figure 1: San Antonio Mineral Zones overview map
https://www.globenewswire.com/NewsRoom/AttachmentNg/0936f57a-e166-4344-8b76-748133e15fba

