What Is The Ownership Structure Like For carsales.com Ltd (ASX:CAR)?
A look at the shareholders of carsales.com Ltd (ASX:CAR) can tell us which group is most powerful. Institutions often own shares in more established companies, while it's not unusual to see insiders own a fair bit of smaller companies. I generally like to see some degree of insider ownership, even if only a little. As Nassim Nicholas Taleb said, 'Don’t tell me what you think, tell me what you have in your portfolio.
carsales.com is a pretty big company. It has a market capitalization of AU$4.6b. Normally institutions would own a significant portion of a company this size. Our analysis of the ownership of the company, below, shows that institutional investors have bought into the company. We can zoom in on the different ownership groups, to learn more about carsales.com.
Check out our latest analysis for carsales.com
What Does The Institutional Ownership Tell Us About carsales.com?
Institutional investors commonly compare their own returns to the returns of a commonly followed index. So they generally do consider buying larger companies that are included in the relevant benchmark index.
carsales.com already has institutions on the share registry. Indeed, they own a respectable stake in the company. This can indicate that the company has a certain degree of credibility in the investment community. However, it is best to be wary of relying on the supposed validation that comes with institutional investors. They too, get it wrong sometimes. It is not uncommon to see a big share price drop if two large institutional investors try to sell out of a stock at the same time. So it is worth checking the past earnings trajectory of carsales.com, (below). Of course, keep in mind that there are other factors to consider, too.

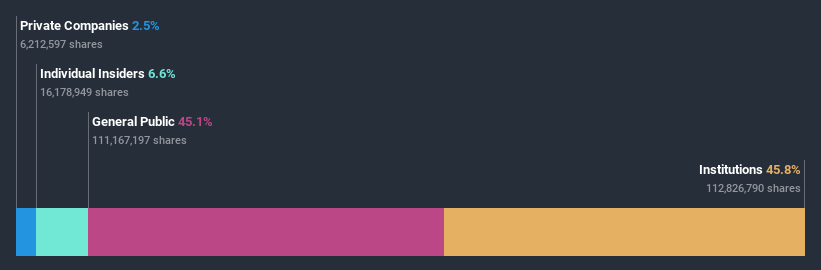
carsales.com is not owned by hedge funds. The Vanguard Group, Inc. is currently the company's largest shareholder with 5.3% of shares outstanding. In comparison, the second and third largest shareholders hold about 5.0% and 4.9% of the stock.
Our studies suggest that the top 25 shareholders collectively control less than half of the company's shares, meaning that the company's shares are widely disseminated and there is no dominant shareholder.
Researching institutional ownership is a good way to gauge and filter a stock's expected performance. The same can be achieved by studying analyst sentiments. Quite a few analysts cover the stock, so you could look into forecast growth quite easily.
Insider Ownership Of carsales.com
The definition of an insider can differ slightly between different countries, but members of the board of directors always count. The company management answer to the board and the latter should represent the interests of shareholders. Notably, sometimes top-level managers are on the board themselves.
Insider ownership is positive when it signals leadership are thinking like the true owners of the company. However, high insider ownership can also give immense power to a small group within the company. This can be negative in some circumstances.
I can report that insiders do own shares in carsales.com Ltd. The insiders have a meaningful stake worth AU$299m. Most would see this as a real positive. It is good to see this level of investment by insiders. You can check here to see if those insiders have been buying recently.
General Public Ownership
The general public holds a 45% stake in carsales.com. This size of ownership, while considerable, may not be enough to change company policy if the decision is not in sync with other large shareholders.
Next Steps:
While it is well worth considering the different groups that own a company, there are other factors that are even more important. Be aware that carsales.com is showing 2 warning signs in our investment analysis , you should know about...
If you would prefer discover what analysts are predicting in terms of future growth, do not miss this free report on analyst forecasts.
NB: Figures in this article are calculated using data from the last twelve months, which refer to the 12-month period ending on the last date of the month the financial statement is dated. This may not be consistent with full year annual report figures.
This article by Simply Wall St is general in nature. It does not constitute a recommendation to buy or sell any stock, and does not take account of your objectives, or your financial situation. We aim to bring you long-term focused analysis driven by fundamental data. Note that our analysis may not factor in the latest price-sensitive company announcements or qualitative material. Simply Wall St has no position in any stocks mentioned.
Have feedback on this article? Concerned about the content? Get in touch with us directly. Alternatively, email editorial-team (at) simplywallst.com.
