Oxford Metrics plc's (LON:OMG) Dismal Stock Performance Reflects Weak Fundamentals
With its stock down 7.5% over the past three months, it is easy to disregard Oxford Metrics (LON:OMG). To decide if this trend could continue, we decided to look at its weak fundamentals as they shape the long-term market trends. In this article, we decided to focus on Oxford Metrics' ROE.
Return on equity or ROE is a key measure used to assess how efficiently a company's management is utilizing the company's capital. In simpler terms, it measures the profitability of a company in relation to shareholder's equity.
Check out our latest analysis for Oxford Metrics
How Do You Calculate Return On Equity?
Return on equity can be calculated by using the formula:
Return on Equity = Net Profit (from continuing operations) ÷ Shareholders' Equity
So, based on the above formula, the ROE for Oxford Metrics is:
8.4% = UK£2.6m ÷ UK£31m (Based on the trailing twelve months to March 2022).
The 'return' is the yearly profit. That means that for every £1 worth of shareholders' equity, the company generated £0.08 in profit.
What Is The Relationship Between ROE And Earnings Growth?
We have already established that ROE serves as an efficient profit-generating gauge for a company's future earnings. We now need to evaluate how much profit the company reinvests or "retains" for future growth which then gives us an idea about the growth potential of the company. Assuming everything else remains unchanged, the higher the ROE and profit retention, the higher the growth rate of a company compared to companies that don't necessarily bear these characteristics.
Oxford Metrics' Earnings Growth And 8.4% ROE
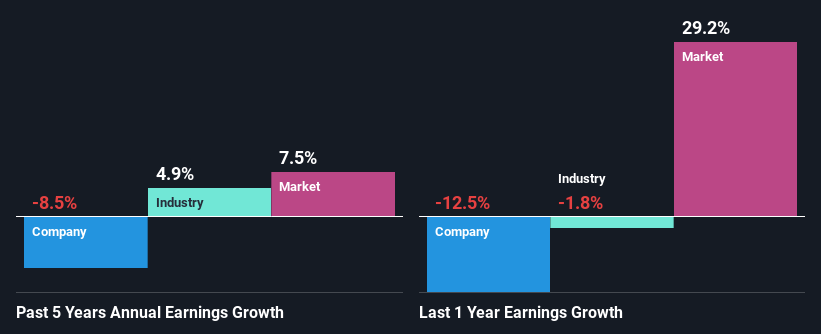
When you first look at it, Oxford Metrics' ROE doesn't look that attractive. Yet, a closer study shows that the company's ROE is similar to the industry average of 8.6%. But then again, Oxford Metrics' five year net income shrunk at a rate of 8.5%. Bear in mind, the company does have a slightly low ROE. So that's what might be causing earnings growth to shrink.
So, as a next step, we compared Oxford Metrics' performance against the industry and were disappointed to discover that while the company has been shrinking its earnings, the industry has been growing its earnings at a rate of 4.9% in the same period.
Earnings growth is an important metric to consider when valuing a stock. What investors need to determine next is if the expected earnings growth, or the lack of it, is already built into the share price. Doing so will help them establish if the stock's future looks promising or ominous. One good indicator of expected earnings growth is the P/E ratio which determines the price the market is willing to pay for a stock based on its earnings prospects. So, you may want to check if Oxford Metrics is trading on a high P/E or a low P/E, relative to its industry.
Is Oxford Metrics Making Efficient Use Of Its Profits?
Oxford Metrics' declining earnings is not surprising given how the company is spending most of its profits in paying dividends, judging by its three-year median payout ratio of 76% (or a retention ratio of 24%). With only a little being reinvested into the business, earnings growth would obviously be low or non-existent. Our risks dashboard should have the 5 risks we have identified for Oxford Metrics.
Additionally, Oxford Metrics has paid dividends over a period of at least ten years, which means that the company's management is determined to pay dividends even if it means little to no earnings growth. Upon studying the latest analysts' consensus data, we found that the company's future payout ratio is expected to drop to 56% over the next three years. Still forecasts suggest that Oxford Metrics' future ROE will drop to 6.2% even though the the company's payout ratio is expected to decrease. This suggests that there could be other factors could driving the anticipated decline in the company's ROE.
Conclusion
In total, we would have a hard think before deciding on any investment action concerning Oxford Metrics. The company has seen a lack of earnings growth as a result of retaining very little profits and whatever little it does retain, is being reinvested at a very low rate of return. So far, we've only made a quick discussion around the company's earnings growth. You can do your own research on Oxford Metrics and see how it has performed in the past by looking at this FREE detailed graph of past earnings, revenue and cash flows.
Have feedback on this article? Concerned about the content? Get in touch with us directly. Alternatively, email editorial-team (at) simplywallst.com.
This article by Simply Wall St is general in nature. We provide commentary based on historical data and analyst forecasts only using an unbiased methodology and our articles are not intended to be financial advice. It does not constitute a recommendation to buy or sell any stock, and does not take account of your objectives, or your financial situation. We aim to bring you long-term focused analysis driven by fundamental data. Note that our analysis may not factor in the latest price-sensitive company announcements or qualitative material. Simply Wall St has no position in any stocks mentioned.
Join A Paid User Research Session
You’ll receive a US$30 Amazon Gift card for 1 hour of your time while helping us build better investing tools for the individual investors like yourself. Sign up here
