S&P 500 FUTURES: FOLLOW THE MONEY
Chicago Mercantile (MrTopStep) - An inline U.S. job report and a jump in construction spending helped propel the Dow to its highest close since October 2007. In the first month of the year the Dow was up 6 percent, the S&P up 5 percent. So why are traders still looking for a top?
Back and fill: Over many years of being on the trading floor I've learned there are certain patterns we follow, and one of them has been showing up all year. It's called "back and fill." Leg up, pull back, make a low and then rally again. This price action has dominated the tape all year. Of the 22 trading days so far this year, the S&P futures have closed higher 16 times or up 11 of the last 13. The average daily gain of the 16 winning days equals +7.18 handles. Of the 6 down days this year, the average decline has been 3.93 handles.
Mutual fund inflows: While domestic funds are seeing a big rebound in 2013, that was not the case in 2012. From January 2012 to Jan. 1, 2013, domestic mutual funds experienced some dramatic outflows. In one year over $151bil was pulled by investors. Some of that money moved into exchange traded funds, but the larger part went into the bond market. Overseas, international funds did not see the exodus like the U.S., with $20bil in investor inflows in 2012. The initial shift was out of the U.S. Domestically outflows have been so persistent that only 8 out of 56 weeks have seen positive inflows, versus international funds, where 30 out of 56 weeks saw positive inflows.

Selling because you're not long: This has been prevalent in the S&P futures since Dec. 28. As the S&P futures climb, most of the buying going on is in the actual stock market. At the end of last year, as people sold to avoid higher taxes and the fiscal cliff, it set into motion "hedging" in the S&P futures. The trade was to either sell stock or hedge the risk by selling the S&P futures. Once the fiscal deal was struck on the last day of the year, investors not only had to get out of the bad bets (selling hedges), they also had to start putting money back to work. As the S&P continued to climb, investors sold bonds and more of the money started moving back into the stock market.
Feeding frenzy: All the buying in the stock market has left the futures going higher but stuck in a low-volume grind. The record 6.9mil mini S&Ps of October 2009 has been replaced by volumes that are well below daily averages. Traders in the S&P futures and options pits have cut back too. With volatility so low, most of of the proprietary trading firms have told their traders to be more selective and to cut positions. This has been an added drag on many trading floor desk operations.
In the end: There is an old saying that "money makes the world go round." At the end of January, mutual fund net inflows hit a four-week total of $20.7bil, the largest inflows since April 2007. The record inflows over the past four weeks are the largest not only for this period since the credit crisis of 2008 but going all the way back to the economic crisis that begain in 2000 during the dot-com bubble. The S&P has gone a long way in the last 5 years and has not hit S&P 1,500 since late 2007. With over $51bil going into stock-related funds in the first month of the year we see no reason to think the rally is over. That doesn't mean that a pullback cannot occur, but we still see higher prices in the short term. 1530-11535, 1550, 1575-76 on tap !
Danny Riley is a 34-year veteran of the trading floor. He has helped run one of the largest S&P desks on the floor of the CME Group since 1985.
Our view:
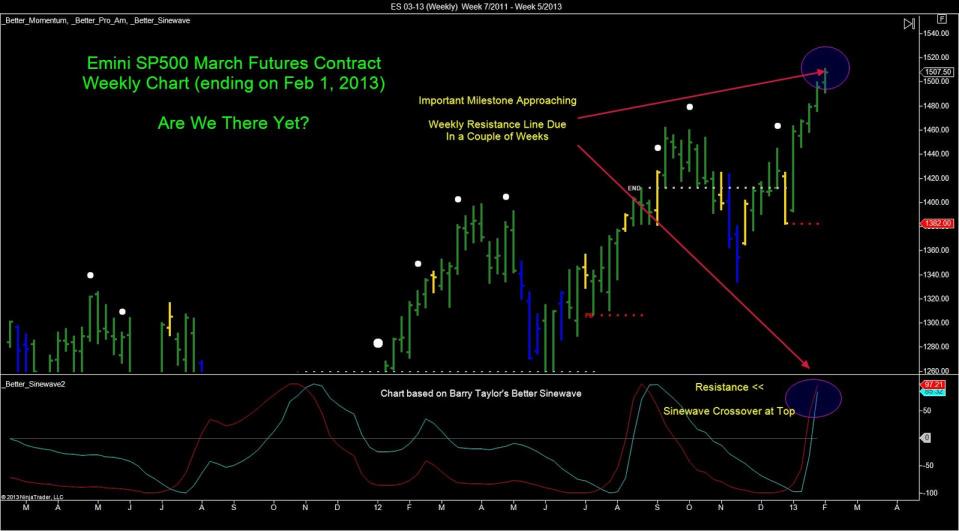
Let's face it, the S&P can pull back at any time, but as long as the central banks are printing money as they are and billions are pouring into stock market related funds, the S&P should have no problem continuing higher. The chart in today's Opening Print points to a channel that falls just short of 1520. Is the S&P nearing a top? We don't think so. Until something actually changes in the price action, we still think the money trade is buying the dip.
It's 7:15 a.m. and the ESH is trading 1499.50, down 7.25 handles; crude is down 1.06 at 96.71; and the euro is down 108 pips at 1.3557.
In Asia, 7 of 11 markets closed higher (Nikkei +0.62, Hang Seng -0.16%)
In Europe, 7 out of 12 markets are trading lower (CAC -1.56%, DAX -1.59%)
Today's headline: "European political worries halt risk asset rally"
Total volume: 1.77mil ESH and 8.1k SPH traded
Fair value: S&P -9.47, NASDAQ -18.41
Economic calendar: Factory orders and a 3 and 6 month T-bill auction.
Mr Top Step Closing Print Video: https://mr-topstep.com/index.php/multimedia/video/latest/closingprint-video-2-1-2013


