Here’s How P/E Ratios Can Help Us Understand CIBT Education Group Inc (TSE:MBA)

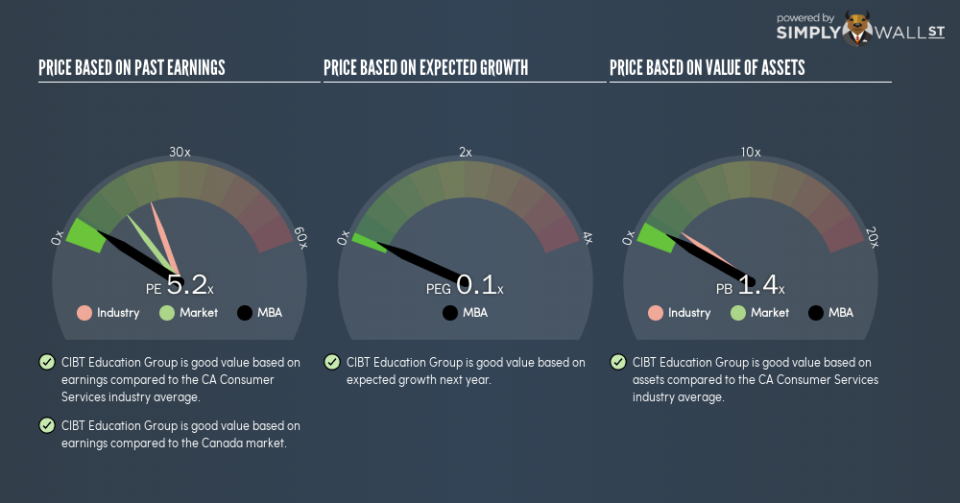
This article is written for those who want to get better at using price to earnings ratios (P/E ratios). We’ll show how you can use CIBT Education Group Inc’s (TSE:MBA) P/E ratio to inform your assessment of the investment opportunity. CIBT Education Group has a price to earnings ratio of 5.2, based on the last twelve months. That corresponds to an earnings yield of approximately 19%.
See our latest analysis for CIBT Education Group
How Do I Calculate A Price To Earnings Ratio?
The formula for P/E is:
Price to Earnings Ratio = Share Price ÷ Earnings per Share (EPS)
Or for CIBT Education Group:
P/E of 5.2 = CA$0.73 ÷ CA$0.14 (Based on the year to May 2018.)
Is A High P/E Ratio Good?
A higher P/E ratio means that buyers have to pay a higher price for each CA$1 the company has earned over the last year. All else being equal, it’s better to pay a low price — but as Warren Buffett said, ‘It’s far better to buy a wonderful company at a fair price than a fair company at a wonderful price.’
How Growth Rates Impact P/E Ratios
Earnings growth rates have a big influence on P/E ratios. Earnings growth means that in the future the ‘E’ will be higher. Therefore, even if you pay a high multiple of earnings now, that multiple will become lower in the future. A lower P/E should indicate the stock is cheap relative to others — and that may attract buyers.
It’s nice to see that CIBT Education Group grew EPS by a stonking 396% in the last year. And its annual EPS growth rate over 5 years is 54%. So we’d generally expect it to have a relatively high P/E ratio.
How Does CIBT Education Group’s P/E Ratio Compare To Its Peers?
We can get an indication of market expectations by looking at the P/E ratio. The image below shows that CIBT Education Group has a lower P/E than the average (20.4) P/E for companies in the consumer services industry.
This suggests that market participants think CIBT Education Group will underperform other companies in its industry. Many investors like to buy stocks when the market is pessimistic about their prospects. It is arguably worth checking if insiders are buying shares, because that might imply they believe the stock is undervalued.
Don’t Forget: The P/E Does Not Account For Debt or Bank Deposits
The ‘Price’ in P/E reflects the market capitalization of the company. Thus, the metric does not reflect cash or debt held by the company. Hypothetically, a company could reduce its future P/E ratio by spending its cash (or taking on debt) to achieve higher earnings.
Spending on growth might be good or bad a few years later, but the point is that the P/E ratio does not account for the option (or lack thereof).
CIBT Education Group’s Balance Sheet
Net debt totals a substantial 176% of CIBT Education Group’s market cap. If you want to compare its P/E ratio to other companies, you must keep in mind that these debt levels would usually warrant a relatively low P/E.
The Verdict On CIBT Education Group’s P/E Ratio
CIBT Education Group trades on a P/E ratio of 5.2, which is below the CA market average of 13.8. The company may have significant debt, but EPS growth was good last year. If it continues to grow, then the current low P/E may prove to be unjustified.
When the market is wrong about a stock, it gives savvy investors an opportunity. As value investor Benjamin Graham famously said, ‘In the short run, the market is a voting machine but in the long run, it is a weighing machine.’ So this free report on the analyst consensus forecasts could help you make a master move on this stock.
Of course you might be able to find a better stock than CIBT Education Group. So you may wish to see this free collection of other companies that have grown earnings strongly.
To help readers see past the short term volatility of the financial market, we aim to bring you a long-term focused research analysis purely driven by fundamental data. Note that our analysis does not factor in the latest price-sensitive company announcements.
The author is an independent contributor and at the time of publication had no position in the stocks mentioned. For errors that warrant correction please contact the editor at editorial-team@simplywallst.com.
