Here’s How P/E Ratios Can Help Us Understand Principal Financial Group, Inc. (NASDAQ:PFG)

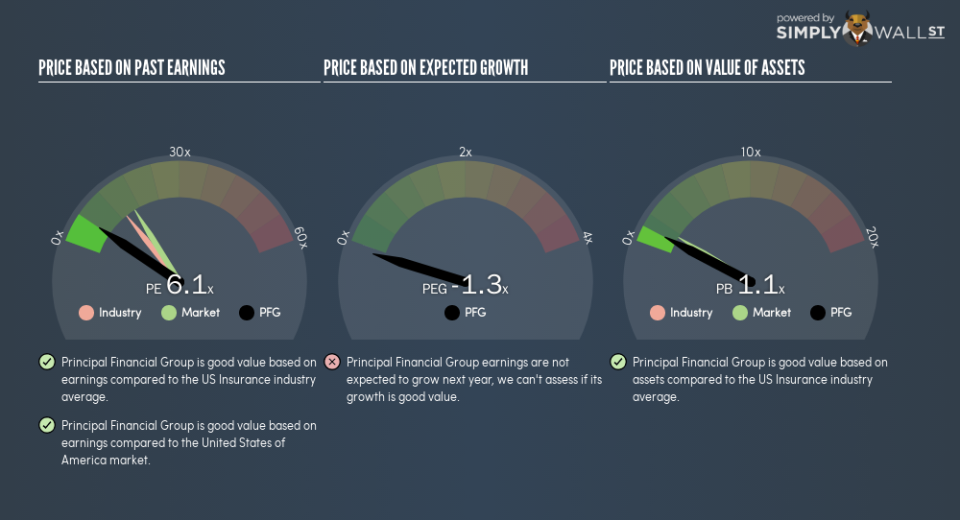
The goal of this article is to teach you how to use price to earnings ratios (P/E ratios). We’ll look at Principal Financial Group, Inc.’s (NASDAQ:PFG) P/E ratio and reflect on what it tells us about the company’s share price. Principal Financial Group has a price to earnings ratio of 6.05, based on the last twelve months. That corresponds to an earnings yield of approximately 17%.
View our latest analysis for Principal Financial Group
How Do I Calculate Principal Financial Group’s Price To Earnings Ratio?
The formula for P/E is:
Price to Earnings Ratio = Price per Share ÷ Earnings per Share (EPS)
Or for Principal Financial Group:
P/E of 6.05 = $45.3 ÷ $7.49 (Based on the year to September 2018.)
Is A High Price-to-Earnings Ratio Good?
A higher P/E ratio means that buyers have to pay a higher price for each $1 the company has earned over the last year. That is not a good or a bad thing per se, but a high P/E does imply buyers are optimistic about the future.
How Growth Rates Impact P/E Ratios
P/E ratios primarily reflect market expectations around earnings growth rates. That’s because companies that grow earnings per share quickly will rapidly increase the ‘E’ in the equation. Therefore, even if you pay a high multiple of earnings now, that multiple will become lower in the future. So while a stock may look expensive based on past earnings, it could be cheap based on future earnings.
Principal Financial Group increased earnings per share by an impressive 21% over the last twelve months. And earnings per share have improved by 20% annually, over the last five years. With that performance, you might expect an above average P/E ratio.
How Does Principal Financial Group’s P/E Ratio Compare To Its Peers?
We can get an indication of market expectations by looking at the P/E ratio. If you look at the image below, you can see Principal Financial Group has a lower P/E than the average (13.5) in the insurance industry classification.
This suggests that market participants think Principal Financial Group will underperform other companies in its industry. Since the market seems unimpressed with Principal Financial Group, it’s quite possible it could surprise on the upside. It is arguably worth checking if insiders are buying shares, because that might imply they believe the stock is undervalued.
Remember: P/E Ratios Don’t Consider The Balance Sheet
It’s important to note that the P/E ratio considers the market capitalization, not the enterprise value. In other words, it does not consider any debt or cash that the company may have on the balance sheet. Theoretically, a business can improve its earnings (and produce a lower P/E in the future), by taking on debt (or spending its remaining cash).
Such spending might be good or bad, overall, but the key point here is that you need to look at debt to understand the P/E ratio in context.
Is Debt Impacting Principal Financial Group’s P/E?
The extra options and safety that comes with Principal Financial Group’s US$321m net cash position means that it deserves a higher P/E than it would if it had a lot of net debt.
The Verdict On Principal Financial Group’s P/E Ratio
Principal Financial Group trades on a P/E ratio of 6.1, which is below the US market average of 16.4. Not only should the net cash position reduce risk, but the recent growth has been impressive. The relatively low P/E ratio implies the market is pessimistic.
Investors should be looking to buy stocks that the market is wrong about. If it is underestimating a company, investors can make money by buying and holding the shares until the market corrects itself. So this free report on the analyst consensus forecasts could help you make a master move on this stock.
But note: Principal Financial Group may not be the best stock to buy. So take a peek at this free list of interesting companies with strong recent earnings growth (and a P/E ratio below 20).
To help readers see past the short term volatility of the financial market, we aim to bring you a long-term focused research analysis purely driven by fundamental data. Note that our analysis does not factor in the latest price-sensitive company announcements.
The author is an independent contributor and at the time of publication had no position in the stocks mentioned. For errors that warrant correction please contact the editor at editorial-team@simplywallst.com.
