Is Paramount Resources Ltd’s (TSE:POU) Balance Sheet Strong Enough To Weather A Storm?

Investors are always looking for growth in small-cap stocks like Paramount Resources Ltd (TSE:POU), with a market cap of CA$1.67b. However, an important fact which most ignore is: how financially healthy is the business? Companies operating in the Oil and Gas industry, in particular ones that run negative earnings, are inclined towards being higher risk. Evaluating financial health as part of your investment thesis is essential. Here are a few basic checks that are good enough to have a broad overview of the company’s financial strength. Though, this commentary is still very high-level, so I’d encourage you to dig deeper yourself into POU here.
How much cash does POU generate through its operations?
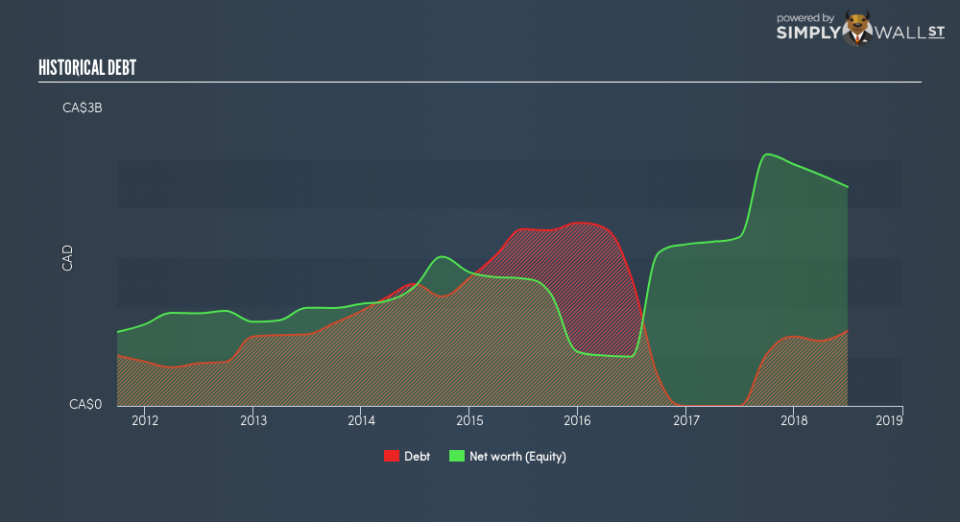
POU has increased its debt level by about CA$758.9m over the last 12 months made up of current and long term debt. With this growth in debt, POU currently has CA$21.6m remaining in cash and short-term investments for investing into the business. On top of this, POU has generated cash from operations of CA$230.0m over the same time period, resulting in an operating cash to total debt ratio of 30.3%, signalling that POU’s current level of operating cash is high enough to cover debt. This ratio can also be interpreted as a measure of efficiency for unprofitable companies since metrics such as return on asset (ROA) requires a positive net income. In POU’s case, it is able to generate 0.3x cash from its debt capital.
Can POU pay its short-term liabilities?
With current liabilities at CA$394.5m, the company has been able to meet these commitments with a current assets level of CA$465.7m, leading to a 1.18x current account ratio. Generally, for Oil and Gas companies, this is a reasonable ratio since there is a bit of a cash buffer without leaving too much capital in a low-return environment.
Is POU’s debt level acceptable?
With a debt-to-equity ratio of 34.2%, POU’s debt level may be seen as prudent. This range is considered safe as POU is not taking on too much debt obligation, which can be restrictive and risky for equity-holders. Risk around debt is very low for POU, and the company also has the ability and headroom to increase debt if needed going forward.
Next Steps:
POU has demonstrated its ability to generate sufficient levels of cash flow, while its debt hovers at an appropriate level. Furthermore, the company exhibits proper management of current assets and upcoming liabilities. I admit this is a fairly basic analysis for POU’s financial health. Other important fundamentals need to be considered alongside. You should continue to research Paramount Resources to get a better picture of the stock by looking at:
Future Outlook: What are well-informed industry analysts predicting for POU’s future growth? Take a look at our free research report of analyst consensus for POU’s outlook.
Historical Performance: What has POU’s returns been like over the past? Go into more detail in the past track record analysis and take a look at the free visual representations of our analysis for more clarity.
Other High-Performing Stocks: Are there other stocks that provide better prospects with proven track records? Explore our free list of these great stocks here.
To help readers see past the short term volatility of the financial market, we aim to bring you a long-term focused research analysis purely driven by fundamental data. Note that our analysis does not factor in the latest price-sensitive company announcements.
The author is an independent contributor and at the time of publication had no position in the stocks mentioned. For errors that warrant correction please contact the editor at editorial-team@simplywallst.com.
