Patterson Companies, Inc. (NASDAQ:PDCO) Delivered A Weaker ROE Than Its Industry

One of the best investments we can make is in our own knowledge and skill set. With that in mind, this article will work through how we can use Return On Equity (ROE) to better understand a business. To keep the lesson grounded in practicality, we’ll use ROE to better understand Patterson Companies, Inc. (NASDAQ:PDCO).
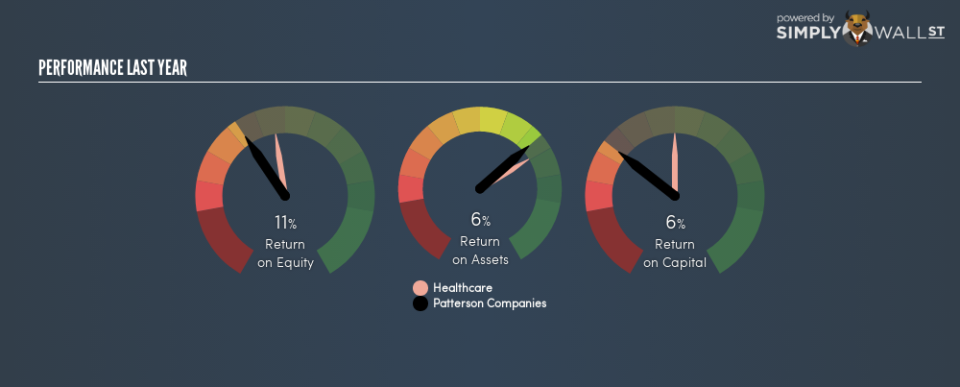
Patterson Companies has a ROE of 11%, based on the last twelve months. One way to conceptualize this, is that for each $1 of shareholders’ equity it has, the company made $0.11 in profit.
See our latest analysis for Patterson Companies
How Do I Calculate Return On Equity?
The formula for ROE is:
Return on Equity = Net Profit ÷ Shareholders’ Equity
Or for Patterson Companies:
11% = 154.296 ÷ US$1.5b (Based on the trailing twelve months to October 2018.)
It’s easy to understand the ‘net profit’ part of that equation, but ‘shareholders’ equity’ requires further explanation. It is all earnings retained by the company, plus any capital paid in by shareholders. The easiest way to calculate shareholders’ equity is to subtract the company’s total liabilities from the total assets.
What Does ROE Mean?
ROE measures a company’s profitability against the profit it retains, and any outside investments. The ‘return’ is the profit over the last twelve months. A higher profit will lead to a higher ROE. So, all else being equal, a high ROE is better than a low one. That means it can be interesting to compare the ROE of different companies.
Does Patterson Companies Have A Good Return On Equity?
One simple way to determine if a company has a good return on equity is to compare it to the average for its industry. However, this method is only useful as a rough check, because companies do differ quite a bit within the same industry classification. As shown in the graphic below, Patterson Companies has a lower ROE than the average (15%) in the Healthcare industry classification.
Unfortunately, that’s sub-optimal. We prefer it when the ROE of a company is above the industry average, but it’s not the be-all and end-all if it is lower. Nonetheless, it might be wise to check if insiders have been selling.
Why You Should Consider Debt When Looking At ROE
Most companies need money — from somewhere — to grow their profits. That cash can come from issuing shares, retained earnings, or debt. In the case of the first and second options, the ROE will reflect this use of cash, for growth. In the latter case, the debt required for growth will boost returns, but will not impact the shareholders’ equity. Thus the use of debt can improve ROE, albeit along with extra risk in the case of stormy weather, metaphorically speaking.
Combining Patterson Companies’s Debt And Its 11% Return On Equity
Although Patterson Companies does use debt, its debt to equity ratio of 0.56 is still low. Its ROE isn’t particularly impressive, but the debt levels are quite modest, so the business probably has some real potential. Conservative use of debt to boost returns is usually a good move for shareholders, though it does leave the company more exposed to interest rate rises.
But It’s Just One Metric
Return on equity is one way we can compare the business quality of different companies. In my book the highest quality companies have high return on equity, despite low debt. If two companies have the same ROE, then I would generally prefer the one with less debt.
But when a business is high quality, the market often bids it up to a price that reflects this. Profit growth rates, versus the expectations reflected in the price of the stock, are a particularly important to consider. So I think it may be worth checking this free report on analyst forecasts for the company.
Of course Patterson Companies may not be the best stock to buy. So you may wish to see this free collection of other companies that have high ROE and low debt.
To help readers see past the short term volatility of the financial market, we aim to bring you a long-term focused research analysis purely driven by fundamental data. Note that our analysis does not factor in the latest price-sensitive company announcements.
The author is an independent contributor and at the time of publication had no position in the stocks mentioned. For errors that warrant correction please contact the editor at editorial-team@simplywallst.com.
