Is Paycom Software Inc’s (NYSE:PAYC) Balance Sheet A Threat To Its Future?

Stocks with market capitalization between $2B and $10B, such as Paycom Software Inc (NYSE:PAYC) with a size of $5.16B, do not attract as much attention from the investing community as do the small-caps and large-caps. However, generally ignored mid-caps have historically delivered better risk-adjusted returns than the two other categories of stocks. Let’s take a look at PAYC’s debt concentration and assess their financial liquidity to get an idea of their ability to fund strategic acquisitions and grow through cyclical pressures. Don’t forget that this is a general and concentrated examination of Amazon’s financial health, so you should conduct further analysis into PAYC here. See our latest analysis for Paycom Software
Does PAYC generate an acceptable amount of cash through operations?
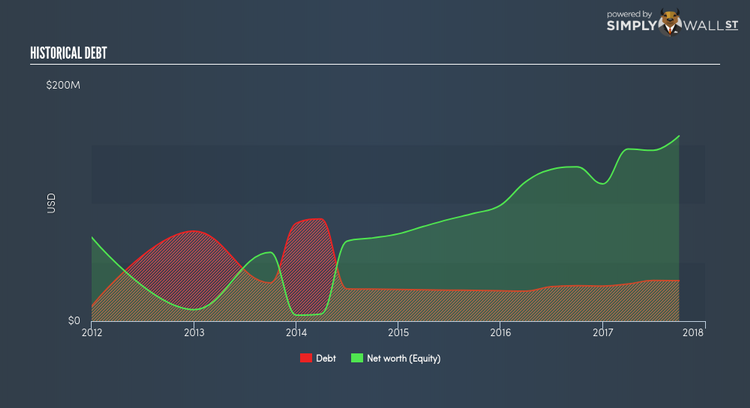
Over the past year, PAYC has ramped up its debt from $25.7M to $29.8M – this includes both the current and long-term debt. With this rise in debt, the current cash and short-term investment levels stands at $60.2M , ready to deploy into the business. Additionally, PAYC has generated cash from operations of $99.0M during the same period of time, resulting in an operating cash to total debt ratio of 331.79%, indicating that PAYC’s debt is appropriately covered by operating cash. This ratio can also be a sign of operational efficiency as an alternative to return on assets. In PAYC’s case, it is able to generate 3.32x cash from its debt capital.
Does PAYC’s liquid assets cover its short-term commitments?
Looking at PAYC’s most recent $898.9M liabilities, the company has been able to meet these commitments with a current assets level of $925.6M, leading to a 1.03x current account ratio. Usually, for Software companies, this is a suitable ratio since there is a bit of a cash buffer without leaving too much capital in a low-return environment.
Is PAYC’s debt level acceptable?
PAYC’s level of debt is appropriate relative to its total equity, at 21.86%. This range is considered safe as PAYC is not taking on too much debt obligation, which may be constraining for future growth. We can check to see whether PAYC is able to meet its debt obligations by looking at the net interest coverage ratio. A company generating earnings before interest and tax (EBIT) at least three times its net interest payments is considered financially sound. In PAYC’s, case, the ratio of 67.74x suggests that interest is comfortably covered, which means that debtors may be willing to loan the company more money, giving PAYC ample headroom to grow its debt facilities.
Next Steps:
PAYC has demonstrated its ability to generate sufficient levels of cash flow, while its debt hovers at an appropriate level. In addition to this, the company exhibits an ability to meet its near term obligations should an adverse event occur. Keep in mind I haven’t considered other factors such as how PAYC has been performing in the past. You should continue to research Paycom Software to get a better picture of the stock by looking at:
1. Future Outlook: What are well-informed industry analysts predicting for PAYC’s future growth? Take a look at our free research report of analyst consensus for PAYC’s outlook.
2. Valuation: What is PAYC worth today? Is the stock undervalued, even when its growth outlook is factored into its intrinsic value? The intrinsic value infographic in our free research report helps visualize whether PAYC is currently mispriced by the market.
3. Other High-Performing Stocks: Are there other stocks that provide better prospects with proven track records? Explore our free list of these great stocks here.
To help readers see pass the short term volatility of the financial market, we aim to bring you a long-term focused research analysis purely driven by fundamental data. Note that our analysis does not factor in the latest price sensitive company announcements.
The author is an independent contributor and at the time of publication had no position in the stocks mentioned.
