What Percentage Of Apollo Consolidated Limited (ASX:AOP) Shares Do Insiders Own?

A look at the shareholders of Apollo Consolidated Limited (ASX:AOP) can tell us which group is most powerful. Insiders often own a large chunk of younger, smaller, companies while huge companies tend to have institutions as shareholders. I quite like to see at least a little bit of insider ownership. As Charlie Munger said ‘Show me the incentive and I will show you the outcome.’
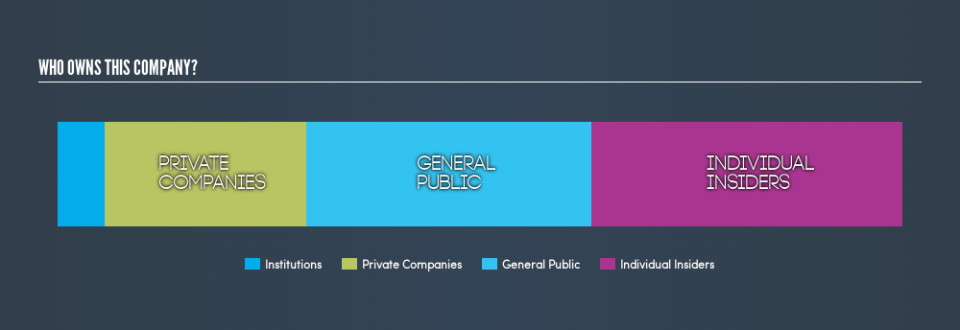
Apollo Consolidated is not a large company by global standards. It has a market capitalization of AU$36m, which means it wouldn’t have the attention of many institutional investors. In the chart below below, we can see that institutions own shares in the company. Let’s take a closer look to see what the different types of shareholder can tell us about AOP.
See our latest analysis for Apollo Consolidated
What Does The Institutional Ownership Tell Us About Apollo Consolidated?
Institutions typically measure themselves against a benchmark when reporting to their own investors, so they often become more enthusiastic about a stock once it’s included in a major index. We would expect most companies to have some institutions on the register, especially if they are growing.
Apollo Consolidated already has institutions on the share registry. Indeed, they own 5.7% of the company. This suggests some credibility amongst professional investors. But we can’t rely on that fact alone, since institutions make bad investments sometimes, just like everyone does. If multiple institutions change their view on a stock at the same time, you could see the share price drop fast. It’s therefore worth looking at Apollo Consolidated’s earnings history, below. Of course, the future is what really matters.

Apollo Consolidated is not owned by hedge funds. Our information suggests that there isn’t any analyst coverage of the stock, so it is probably little known.
Insider Ownership Of Apollo Consolidated
The definition of an insider can differ slightly between different countries, but members of the board of directors always count. The company management answer to the board; and the latter should represent the interests of shareholders. Notably, sometimes top-level managers are on the board, themselves.
Insider ownership is positive when it signals leadership are thinking like the true owners of the company. However, high insider ownership can also give immense power to a small group within the company. This can be negative in some circumstances.
It seems insiders own a significant proportion of Apollo Consolidated Limited. It has a market capitalization of just AU$36m, and insiders have AU$13m worth of shares in their own names. It is great to see insiders so invested in the business. It might be worth checking if those insiders have been buying recently.
General Public Ownership
With a 34% ownership, the general public have some degree of sway over AOP. While this size of ownership may not be enough to sway a policy decision in their favour, they can still make a collective impact on company policies.
Private Company Ownership
It seems that Private Companies own 24%, of the AOP stock. Private companies may be related parties. Sometimes insiders have an interest in a public company through a holding in a private company, rather than in their own capacity as an individual. While it’s hard to draw any broad stroke conclusions, it is worth noting as an area for further research.
Next Steps:
While it is well worth considering the different groups that own a company, there are other factors that are even more important.
Many find it useful to take an in depth look at how a company has performed in the past. You can access this detailed graph of past earnings, revenue and cash flow .
Of course, you might find a fantastic investment by looking elsewhere. So take a peek at this free list of interesting companies.
NB: Figures in this article are calculated using data from the last twelve months, which refer to the 12-month period ending on the last date of the month the financial statement is dated. This may not be consistent with full year annual report figures.
We aim to bring you long-term focused research analysis driven by fundamental data. Note that our analysis may not factor in the latest price-sensitive company announcements or qualitative material.
If you spot an error that warrants correction, please contact the editor at editorial-team@simplywallst.com. This article by Simply Wall St is general in nature. It does not constitute a recommendation to buy or sell any stock, and does not take account of your objectives, or your financial situation. Simply Wall St has no position in the stocks mentioned. Thank you for reading.
