What Percentage Of Tasman Resources Ltd (ASX:TAS) Shares Do Insiders Own?

If you want to know who really controls Tasman Resources Ltd (ASX:TAS), then you'll have to look at the makeup of its share registry. Insiders often own a large chunk of younger, smaller, companies while huge companies tend to have institutions as shareholders. Warren Buffett said that he likes 'a business with enduring competitive advantages that is run by able and owner-oriented people'. So it's nice to see some insider ownership, because it may suggest that management is owner-oriented.
Tasman Resources is not a large company by global standards. It has a market capitalization of AU$30m, which means it wouldn't have the attention of many institutional investors. In the chart below below, we can see that institutions don't own shares in the company. We can zoom in on the different ownership groups, to learn more about TAS.
View our latest analysis for Tasman Resources
What Does The Lack Of Institutional Ownership Tell Us About Tasman Resources?
Small companies that are not very actively traded often lack institutional investors, but it's less common to see large companies without them.
There are many reasons why a company might not have any institutions on the share registry. It may be hard for institutions to buy large amounts of shares, if liquidity (the amount of shares traded each day) is low. If the company has not needed to raise capital, institutions might lack the opportunity to build a position. Alternatively, there might be something about the company that has kept institutional investors away. Tasman Resources's earnings and revenue track record (below) may not be compelling to institutional investors -- or they simply might not have looked at the business closely.

Hedge funds don't have many shares in Tasman Resources. Our information suggests that there isn't any analyst coverage of the stock, so it is probably little known.
Insider Ownership Of Tasman Resources
The definition of company insiders can be subjective, and does vary between jurisdictions. Our data reflects individual insiders, capturing board members at the very least. Management ultimately answers to the board. However, it is not uncommon for managers to be executive board members, especially if they are a founder or the CEO.
Insider ownership is positive when it signals leadership are thinking like the true owners of the company. However, high insider ownership can also give immense power to a small group within the company. This can be negative in some circumstances.
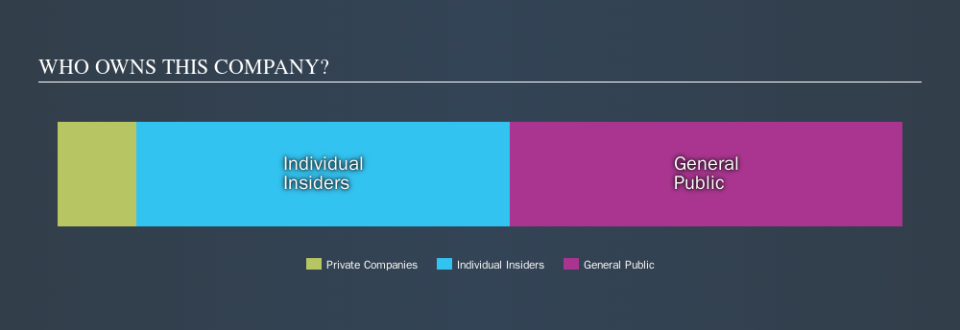
Our most recent data indicates that insiders own a reasonable proportion of Tasman Resources Ltd. It has a market capitalization of just AU$30m, and insiders have AU$13m worth of shares in their own names. I would say this shows alignment with shareholders, but it is worth noting that the company is still quite small; some insiders may have founded the business. You can click here to see if those insiders have been buying or selling.
General Public Ownership
With a 46% ownership, the general public have some degree of sway over TAS. While this size of ownership may not be enough to sway a policy decision in their favour, they can still make a collective impact on company policies.
Private Company Ownership
It seems that Private Companies own 9.5%, of the TAS stock. Private companies may be related parties. Sometimes insiders have an interest in a public company through a holding in a private company, rather than in their own capacity as an individual. While it's hard to draw any broad stroke conclusions, it is worth noting as an area for further research.
Next Steps:
It's always worth thinking about the different groups who own shares in a company. But to understand Tasman Resources better, we need to consider many other factors.
I always like to check for a history of revenue growth. You can too, by accessing this free chart of historic revenue and earnings in this detailed graph.
Of course, you might find a fantastic investment by looking elsewhere. So take a peek at this free list of interesting companies.
NB: Figures in this article are calculated using data from the last twelve months, which refer to the 12-month period ending on the last date of the month the financial statement is dated. This may not be consistent with full year annual report figures.
We aim to bring you long-term focused research analysis driven by fundamental data. Note that our analysis may not factor in the latest price-sensitive company announcements or qualitative material.
If you spot an error that warrants correction, please contact the editor at editorial-team@simplywallst.com. This article by Simply Wall St is general in nature. It does not constitute a recommendation to buy or sell any stock, and does not take account of your objectives, or your financial situation. Simply Wall St has no position in the stocks mentioned. Thank you for reading.
