Peter Lynch Screens Identify Opportunities for 2019
- By James Li
As the stock markets continue fluctuating over the first three weeks of 2019, investors continue seeking good opportunities for the months ahead.
According to the Peter Lynch price-earnings screen, the top three stocks are Hennessy Advisors Inc. (HNNA), Westlake Chemical Corp. (WLK) and Eagle Materials Inc. (EXP).
Dow begins rebounding from two-year low, yet volatility remains high
Warning! GuruFocus has detected 7 Warning Signs with BTI. Click here to check it out.
The intrinsic value of HNNA
Despite trading near an intraday high of 24,854.36, up approximately 301 points from Thursday's close of 24,553.24, the Dow Jones Industrial Average closed at 24,737.20 on Friday, down approximately 117 points from the intraday high. Market volatility remains high on several ongoing factors, including the government shutdown, which was temporarily resolved on Friday, and the U.S.-China trade war.

Stocks gained as President Trump announced a deal with Congress that funds the government until Feb. 15. CNBC columnist Michael Sheetz quoted two analysts with different perspectives: while Fundstrat Global Advisors strategist Tom Block said the reopening of the government is a "positive for Wall Street," KKM Financial CEO Jeff Kilburg said traders are expected to "take profits" as the D.C. dysfunction continues.
Value screeners recap
As we saw in previous articles, GuruFocus offers a wide variety of value screens, including Benjamin Graham's net-net screen and the Buffett-Munger screen, which selects stocks based on Berkshire Hathaway Inc. (BRK-A)(BRK-B) co-managers Warren Buffett (Trades, Portfolio) and Charlie Munger (Trades, Portfolio)'s investing criteria. Table 1 shows the value screener record counts for each of our value screens, located under the Screeners tab, over the past week for the U.S. region.
Screener | Jan. 21 | Jan. 22 | Jan. 23 | Jan. 24 | Jan. 25 |
Graham Net-Net | 279 | 283 | 282 | 283 | 281 |
Undervalued Predict | 68 | 69 | 67 | 71 | 71 |
Buffett-Munger | 25 | 27 | 26 | 28 | 27 |
Peter Lynch PE | 47 | 49 | 48 | 47 | 55 |
Peter Lynch PS | 162 | 169 | 162 | 161 | 174 |
Peter Lynch PB | 222 | 234 | 229 | 222 | 255 |
Lynch p2ebitda | 226 | 225 | 215 | 219 | 249 |
Hist Low PS | 44 | 46 | 49 | 47 | 44 |
Hist Low PB | 62 | 63 | 63 | 62 | 60 |
High Div Yield | 73 | 72 | 71 | 70 | 63 |
Magic Formula | 4282 | 4286 | 4188 | 4254 | 4234 |
Table 1: Value screener record for the U.S.
Tables 2 and 3 show the value screener record counts for Europe and Asia.
Screener | Jan. 21 | Jan. 22 | Jan. 23 | Jan. 24 | Jan. 25 |
Graham Net-Net | 296 | 272 | 272 | 276 | 275 |
Undervalued Predict | 98 | 81 | 78 | 86 | 88 |
Buffett-Munger | 47 | 41 | 39 | 43 | 44 |
Peter Lynch PE | 56 | 45 | 44 | 46 | 44 |
Peter Lynch PS | 153 | 128 | 119 | 137 | 132 |
Peter Lynch PB | 203 | 162 | 163 | 168 | 175 |
Lynch p2ebitda | 258 | 202 | 192 | 206 | 195 |
Hist Low PS | 38 | 40 | 44 | 41 | 39 |
Hist Low PB | 50 | 51 | 54 | 52 | 50 |
High Div Yield | 103 | 101 | 102 | 101 | 99 |
Magic Formula | 5953 | 5274 | 5182 | 5243 | 5293 |
Table 2: Value screener record for Europe
Screener | Jan. 21 | Jan. 22 | Jan. 23 | Jan. 24 | Jan. 25 |
Graham Net-Net | 643 | 649 | 649 | 646 | 639 |
Undervalued Predict | 69 | 71 | 73 | 70 | 69 |
Buffett-Munger | 75 | 77 | 77 | 75 | 75 |
Peter Lynch PE | 75 | 74 | 76 | 74 | 74 |
Peter Lynch PS | 123 | 126 | 128 | 121 | 120 |
Peter Lynch PB | 142 | 140 | 141 | 136 | 132 |
Lynch p2ebitda | 148 | 153 | 152 | 149 | 147 |
Hist Low PS | 128 | 125 | 128 | 41 | 130 |
Hist Low PB | 139 | 132 | 142 | 52 | 133 |
High Div Yield | 27 | 26 | 26 | 24 | 25 |
Magic Formula | 12617 | 12634 | 12635 | 12632 | 12631 |
Table 3: Value screener record for Asia
Legendary investor Peter Lynch, author of "One Up on Wall Street," developed a chart containing two financial series: a company's stock price and the price at a price-earnings ratio of 15. GuruFocus displays a Peter Lynch Chart on each company's summary page: Figure 1 shows a sample chart for Apple Inc. (AAPL), Buffett's largest holding.
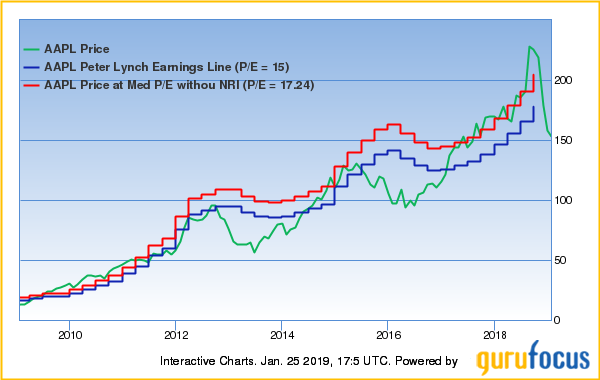
Figure 1
Hennessy Advisors
Hennessy Advisors, the top stock on the Peter Lynch screen, is trading at a price-earnings ratio of 4.21, close to a 10-year low of 3.71.
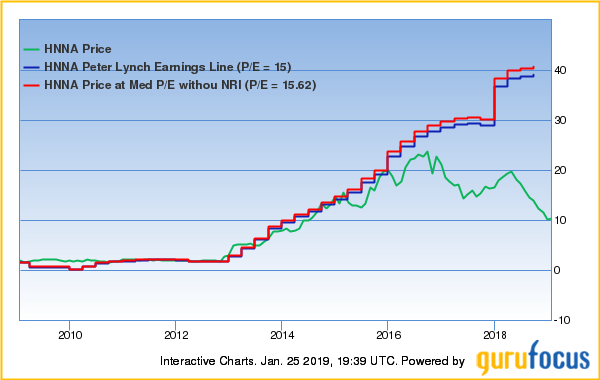
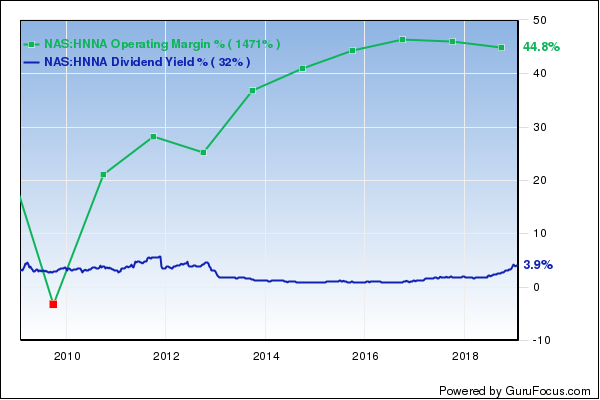
Hennessy Advisors manages a wide variety of funds, including the Hennessy Japan Fund (Trades, Portfolio) and the Hennessy Japan Small Cap Fund (Trades, Portfolio). GuruFocus ranks the asset management company's profitability 9 out of 10 on several positive signs, which include expanding profit margins and a dividend yield of 3.72%, close to a five-year high. Additionally, the company's Joel Greenblatt (Trades, Portfolio) return on capital of 7,529.05% ranks higher than 95% of global competitors.
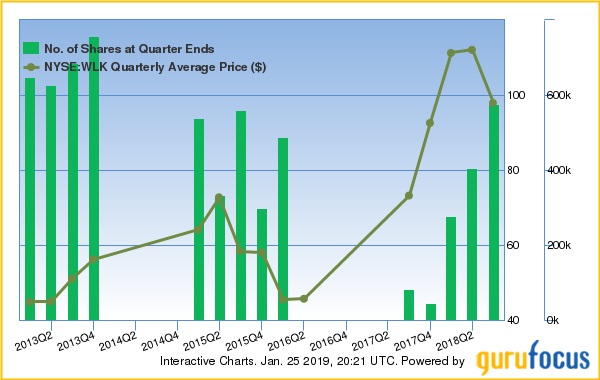
Westlake Chemical
Westlake Chemical, the second-highest ranked stock on the list, is trading at a price-earnings ratio close to a 10-year low of 5.87.

The Houston-based specialty chemicals company produces fabricated products through two business segments: Olefins and Vinyls. GuruFocus ranks the company's profitability 9 out of 10 on several positive signs, which include a strong Piotroski F-score of 8 and a three-year revenue growth rate of 23.40%, a rate that outperforms 92% of global competitors. Additionally, Westlake Chemical's business predictability ranks a solid 3.5 stars out of five.

Gurus with large holdings in Westlake Chemical include Jim Simons (Trades, Portfolio) and Chuck Royce (Trades, Portfolio); the latter is the keynote speaker at our value conference in May.
Eagle Materials
Eagle Materials, the third-highest ranked stock on the list, is trading at a price-earnings ratio of 11.69.
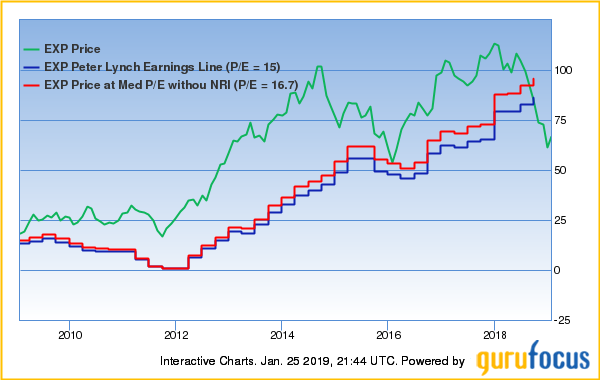
The Dallas-based company produces and supplies construction products, building materials and materials used in oil and gas extraction. GuruFocus ranks the company's profitability 8 out of 10 on several positive signs, which include expanding profit margins and a strong Piotroski F-score of 7.

See also
Other top stocks on the Peter Lynch price-earnings screen include Southwest Airlines Co. (LUV), Marten Transport Ltd. (MRTN) and Universal Forest Products Inc. (UFPI).
Disclosure: No positions.
Read more here:
Mario Gabelli Sees Strong Global Growth in 2020
A Look at Valuations for Top European and Asian Markets
Warren Buffett's Market Indicator Eclipses 130% Ahead of MLK Day
This article first appeared on GuruFocus.
Warning! GuruFocus has detected 7 Warning Signs with BTI. Click here to check it out.
The intrinsic value of HNNA
