Pizza Pizza Royalty (TSE:PZA) shareholders have earned a 44% return over the last year
The simplest way to invest in stocks is to buy exchange traded funds. But if you pick the right individual stocks, you could make more than that. To wit, the Pizza Pizza Royalty Corp. (TSE:PZA) share price is 35% higher than it was a year ago, much better than the market return of around 15% (not including dividends) in the same period. If it can keep that out-performance up over the long term, investors will do very well! Looking back further, the stock price is 35% higher than it was three years ago.
Now it's worth having a look at the company's fundamentals too, because that will help us determine if the long term shareholder return has matched the performance of the underlying business.
See our latest analysis for Pizza Pizza Royalty
While the efficient markets hypothesis continues to be taught by some, it has been proven that markets are over-reactive dynamic systems, and investors are not always rational. By comparing earnings per share (EPS) and share price changes over time, we can get a feel for how investor attitudes to a company have morphed over time.
During the last year, Pizza Pizza Royalty actually saw its earnings per share drop 2.3%.
We don't think that the decline in earnings per share is a good measure of the business over the last twelve months. Since the change in EPS doesn't seem to correlate with the change in share price, it's worth taking a look at other metrics.
For starters, we suspect the share price has been buoyed by the dividend, which was increased during the year. Income-seeking investors probably helped bid up the stock price.
The graphic below depicts how earnings and revenue have changed over time (unveil the exact values by clicking on the image).
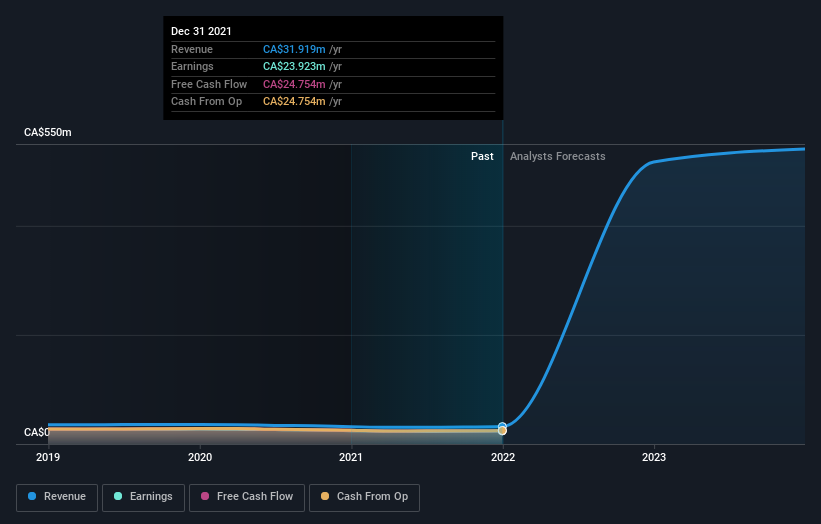
We like that insiders have been buying shares in the last twelve months. Having said that, most people consider earnings and revenue growth trends to be a more meaningful guide to the business. You can see what analysts are predicting for Pizza Pizza Royalty in this interactive graph of future profit estimates.
What About Dividends?
It is important to consider the total shareholder return, as well as the share price return, for any given stock. Whereas the share price return only reflects the change in the share price, the TSR includes the value of dividends (assuming they were reinvested) and the benefit of any discounted capital raising or spin-off. So for companies that pay a generous dividend, the TSR is often a lot higher than the share price return. As it happens, Pizza Pizza Royalty's TSR for the last 1 year was 44%, which exceeds the share price return mentioned earlier. And there's no prize for guessing that the dividend payments largely explain the divergence!
A Different Perspective
We're pleased to report that Pizza Pizza Royalty shareholders have received a total shareholder return of 44% over one year. Of course, that includes the dividend. Since the one-year TSR is better than the five-year TSR (the latter coming in at 3% per year), it would seem that the stock's performance has improved in recent times. In the best case scenario, this may hint at some real business momentum, implying that now could be a great time to delve deeper. It's always interesting to track share price performance over the longer term. But to understand Pizza Pizza Royalty better, we need to consider many other factors. Even so, be aware that Pizza Pizza Royalty is showing 2 warning signs in our investment analysis , you should know about...
Pizza Pizza Royalty is not the only stock insiders are buying. So take a peek at this free list of growing companies with insider buying.
Please note, the market returns quoted in this article reflect the market weighted average returns of stocks that currently trade on CA exchanges.
Have feedback on this article? Concerned about the content? Get in touch with us directly. Alternatively, email editorial-team (at) simplywallst.com.
This article by Simply Wall St is general in nature. We provide commentary based on historical data and analyst forecasts only using an unbiased methodology and our articles are not intended to be financial advice. It does not constitute a recommendation to buy or sell any stock, and does not take account of your objectives, or your financial situation. We aim to bring you long-term focused analysis driven by fundamental data. Note that our analysis may not factor in the latest price-sensitive company announcements or qualitative material. Simply Wall St has no position in any stocks mentioned.
