Is Playtech plc’s (LON:PTEC) Balance Sheet A Threat To Its Future?

Investors are always looking for growth in small-cap stocks like Playtech plc (LON:PTEC), with a market cap of UK£1.5b. However, an important fact which most ignore is: how financially healthy is the business? Assessing first and foremost the financial health is crucial, as mismanagement of capital can lead to bankruptcies, which occur at a higher rate for small-caps. I believe these basic checks tell most of the story you need to know. Nevertheless, since I only look at basic financial figures, I recommend you dig deeper yourself into PTEC here.
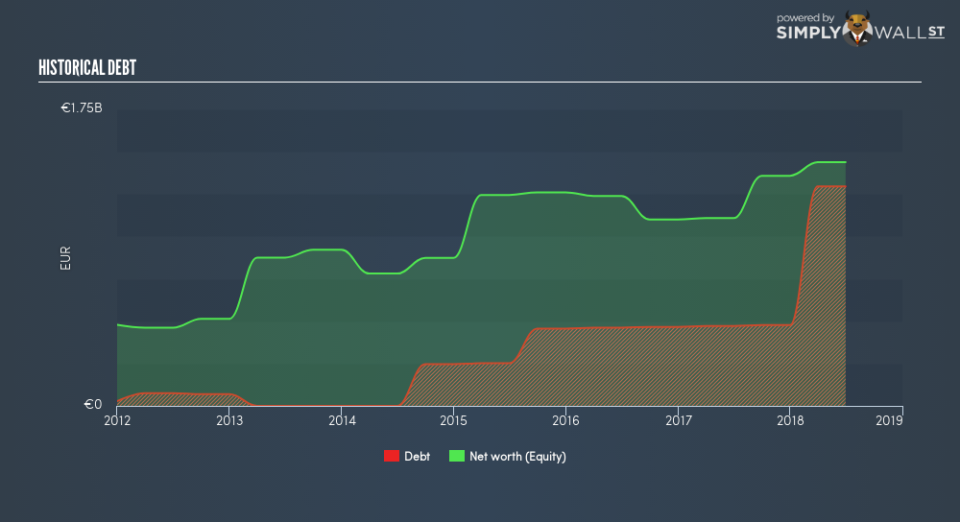
How much cash does PTEC generate through its operations?
PTEC’s debt levels surged from €471m to €1.3b over the last 12 months – this includes long-term debt. With this increase in debt, PTEC currently has €937m remaining in cash and short-term investments for investing into the business. Additionally, PTEC has generated €382m in operating cash flow over the same time period, leading to an operating cash to total debt ratio of 29%, meaning that PTEC’s debt is appropriately covered by operating cash. This ratio can also be a sign of operational efficiency as an alternative to return on assets. In PTEC’s case, it is able to generate 0.29x cash from its debt capital.
Does PTEC’s liquid assets cover its short-term commitments?
Looking at PTEC’s €1.2b in current liabilities, it seems that the business has maintained a safe level of current assets to meet its obligations, with the current ratio last standing at 1.03x. For Hospitality companies, this ratio is within a sensible range since there is a bit of a cash buffer without leaving too much capital in a low-return environment.
Can PTEC service its debt comfortably?
With a debt-to-equity ratio of 90%, PTEC can be considered as an above-average leveraged company. This is not unusual for small-caps as debt tends to be a cheaper and faster source of funding for some businesses.
Next Steps:
PTEC’s high cash coverage means that, although its debt levels are high, the company is able to utilise its borrowings efficiently in order to generate cash flow. Since there is also no concerns around PTEC’s liquidity needs, this may be its optimal capital structure for the time being. This is only a rough assessment of financial health, and I’m sure PTEC has company-specific issues impacting its capital structure decisions. I suggest you continue to research Playtech to get a better picture of the small-cap by looking at:
Future Outlook: What are well-informed industry analysts predicting for PTEC’s future growth? Take a look at our free research report of analyst consensus for PTEC’s outlook.
Valuation: What is PTEC worth today? Is the stock undervalued, even when its growth outlook is factored into its intrinsic value? The intrinsic value infographic in our free research report helps visualize whether PTEC is currently mispriced by the market.
Other High-Performing Stocks: Are there other stocks that provide better prospects with proven track records? Explore our free list of these great stocks here.
To help readers see past the short term volatility of the financial market, we aim to bring you a long-term focused research analysis purely driven by fundamental data. Note that our analysis does not factor in the latest price-sensitive company announcements.
The author is an independent contributor and at the time of publication had no position in the stocks mentioned. For errors that warrant correction please contact the editor at editorial-team@simplywallst.com.
