Positive earnings growth hasn't been enough to get New York Community Bancorp (NYSE:NYCB) shareholders a favorable return over the last five years
The main aim of stock picking is to find the market-beating stocks. But in any portfolio, there will be mixed results between individual stocks. At this point some shareholders may be questioning their investment in New York Community Bancorp, Inc. (NYSE:NYCB), since the last five years saw the share price fall 31%. Shareholders have had an even rougher run lately, with the share price down 14% in the last 90 days. Of course, this share price action may well have been influenced by the 18% decline in the broader market, throughout the period.
The recent uptick of 4.5% could be a positive sign of things to come, so let's take a lot at historical fundamentals.
Check out our latest analysis for New York Community Bancorp
There is no denying that markets are sometimes efficient, but prices do not always reflect underlying business performance. One way to examine how market sentiment has changed over time is to look at the interaction between a company's share price and its earnings per share (EPS).
During the unfortunate half decade during which the share price slipped, New York Community Bancorp actually saw its earnings per share (EPS) improve by 4.8% per year. So it doesn't seem like EPS is a great guide to understanding how the market is valuing the stock. Alternatively, growth expectations may have been unreasonable in the past.
By glancing at these numbers, we'd posit that the the market had expectations of much higher growth, five years ago. Looking to other metrics might better explain the share price change.
We note that the dividend has remained healthy, so that wouldn't really explain the share price drop. While it's not completely obvious why the share price is down, a closer look at the company's history might help explain it.
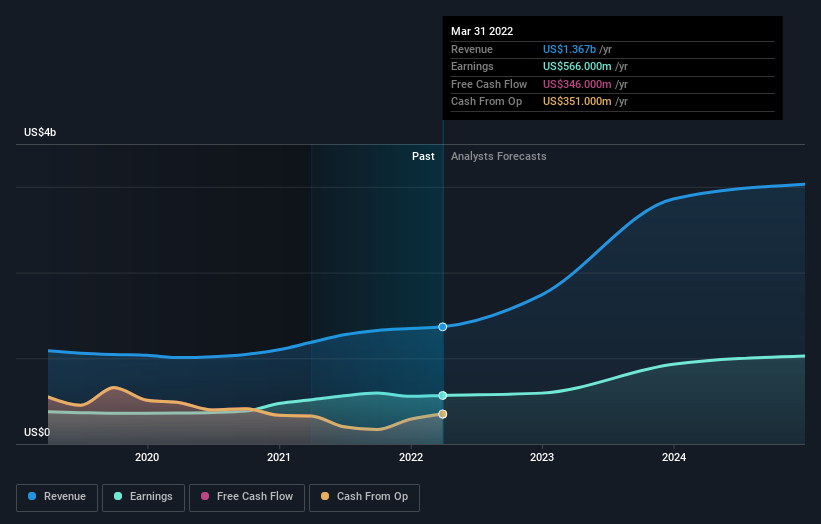
You can see below how earnings and revenue have changed over time (discover the exact values by clicking on the image).
It's probably worth noting we've seen significant insider buying in the last quarter, which we consider a positive. On the other hand, we think the revenue and earnings trends are much more meaningful measures of the business. So it makes a lot of sense to check out what analysts think New York Community Bancorp will earn in the future (free profit forecasts).
What About Dividends?
As well as measuring the share price return, investors should also consider the total shareholder return (TSR). The TSR incorporates the value of any spin-offs or discounted capital raisings, along with any dividends, based on the assumption that the dividends are reinvested. Arguably, the TSR gives a more comprehensive picture of the return generated by a stock. In the case of New York Community Bancorp, it has a TSR of -6.3% for the last 5 years. That exceeds its share price return that we previously mentioned. The dividends paid by the company have thusly boosted the total shareholder return.
A Different Perspective
While it's never nice to take a loss, New York Community Bancorp shareholders can take comfort that , including dividends,their trailing twelve month loss of 14% wasn't as bad as the market loss of around 21%. Unfortunately, last year's performance may indicate unresolved challenges, given that it's worse than the annualised loss of 1.2% over the last half decade. Whilst Baron Rothschild does tell the investor "buy when there's blood in the streets, even if the blood is your own", buyers would need to examine the data carefully to be comfortable that the business itself is sound. I find it very interesting to look at share price over the long term as a proxy for business performance. But to truly gain insight, we need to consider other information, too. Consider risks, for instance. Every company has them, and we've spotted 1 warning sign for New York Community Bancorp you should know about.
If you like to buy stocks alongside management, then you might just love this free list of companies. (Hint: insiders have been buying them).
Please note, the market returns quoted in this article reflect the market weighted average returns of stocks that currently trade on US exchanges.
Have feedback on this article? Concerned about the content? Get in touch with us directly. Alternatively, email editorial-team (at) simplywallst.com.
This article by Simply Wall St is general in nature. We provide commentary based on historical data and analyst forecasts only using an unbiased methodology and our articles are not intended to be financial advice. It does not constitute a recommendation to buy or sell any stock, and does not take account of your objectives, or your financial situation. We aim to bring you long-term focused analysis driven by fundamental data. Note that our analysis may not factor in the latest price-sensitive company announcements or qualitative material. Simply Wall St has no position in any stocks mentioned.
