Price-to-Rent Ratio in the 50 Largest U.S. Cities – 2021 Edition

Depending on your circumstances, renting or buying a home can be a smart financial decision. Homeownership can help you build equity and lower taxes, while renting offers greater flexibility and convenient services. Keeping this in mind, SmartAsset ranked the 50 largest U.S. cities according to price-to-rent ratio.
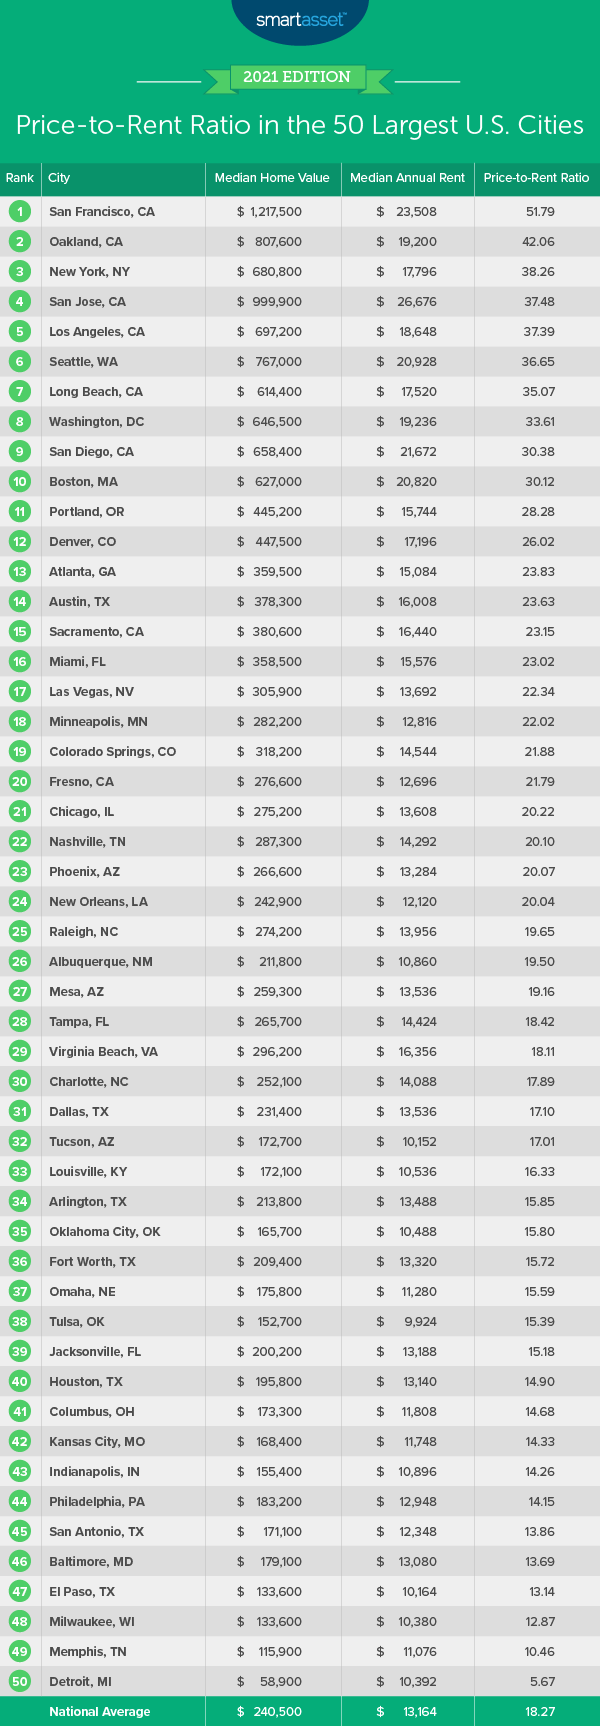
To calculate the price-to-rent ratios for the 50 biggest cities nationwide, we took a look at how the median home value correlates to the median annual rent. Generally, a lower price-to-rent ratio means conditions are more favorable for buying a home and a higher price-to-rent ratio means renting is favorable. According to Trulia’s Rent vs. Buy Index, the specific thresholds are as follows: a price-to-rent ratio of 1 to 15 indicates that buying is more favorable, a ratio of 16 to 20 indicates that renting is typically more favorable and a ratio of 21 or more indicates that renting is more favorable. For details on our data sources and how we put all the information together to create our final rankings, check out the Data and Methodology section below.
This is SmartAsset’s 2021 study on the price-to-rent ratio in the 50 largest U.S. cities. Read the 2020 edition here.
Key Findings
The largest U.S. cities are good for renters. San Francisco, New York, San Jose, Seattle and Los Angeles are all in the top 10 of this study, and are all among the most populous cities in the country. Furthermore, the national price-to-rent ratio is 18.27, meaning that the market is still generally favorable to renters. Medium-sized cities like Memphis, El Paso and Baltimore, on the other hand, are better for buyers.
Renter-friendly cities populate California, while the Midwest is better for buyers. Of the 10 cities in our study where buying is more favorable than renting, five are in the Midwest. The median home value across these five cities, on average, is about $137,900.
Cities With the Highest Price-to-Rent Ratios: Where Renting Is More Favorable Than Buying
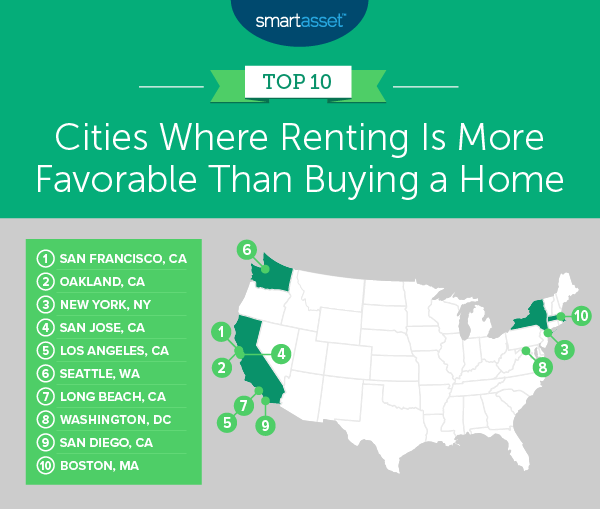
1. San Francisco, CA
San Francisco, California is the first of three Bay Area cities in the top five of this study. The median home value is $1,217,500 (the most expensive on this list) and the median annual rent is $23,508 (second-highest after San Jose), putting the price-to-rent ratio at 51.79 (the highest in this study).
2. Oakland, CA
Across the bay, Oakland, California has the third-highest median home value ($807,600) and the seventh-highest median annual rent ($19,200). This puts the price-to-rent ratio at 42.06.
3. New York, NY
The Big Apple has the ninth-highest median annual rent ($17,796) and the sixth-highest median home value ($680,800). The price-to-rent ratio is 38.26.
4. San Jose, CA
San Jose, California has the highest median annual rent in the study ($26,676). The median home value ranks second after San Francisco ($999,900), setting the price-to-rent ratio at 37.48.
5. Los Angeles, CA
Los Angeles has the fifth-highest median home value in 2019 ($697,200) and the eighth-highest median annual rent ($18,648). The price-to-rent ratio is 37.39.
Cities With the Lowest Price-to-Rent Ratios: Where Buying Is More Favorable Than Renting
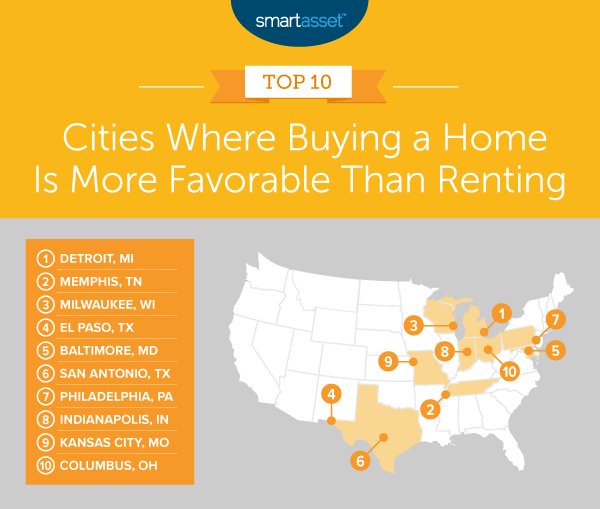
1. Detroit, MI
Detroit, Michigan has the lowest median home value in our study ($58,900) and the fifth-lowest median annual rent ($10,392). That puts the price-to-rent ratio at 5.67.
2. Memphis, TN
Memphis, Tennessee has the second-lowest median home value after Detroit ($115,900) and the 10th-lowest median annual rent ($11,076). The price-to-rent ratio is 10.46.
3. Milwaukee, WI
Milwaukee, Wisconsin’s price-to-rent ratio is 12.87. It is tied in our list for the third-lowest median home value ($133,600) and has the fourth-lowest median annual rent ($10,380).
4. El Paso, TX
El Paso, Texas has the third-lowest median annual rent ($10,164) and is tied with Milwaukee for the third-lowest median home value ($133,600). The price-to-rent ratio is 13.14.
5. Baltimore, MD
Baltimore, Maryland has the 14th-lowest median home value ($179,100) and the 19th-lowest median annual rent ($13,080). This makes the price-to-rent ratio 13.69.
Data and Methodology
To find the cities in America with the highest and lowest price-to-rent ratios, we looked at the median home values and median rent for the 50 largest cities in America. We divided the median home value for each city by the median annual rent for the city to calculate the price-to-rent ratio and ranked the cities according to this figure. The city with the highest price-to-rent ratio was the most favorable for renters, and the city with the lowest price-to-rent ratio was the most favorable for homebuyers.
All data comes from the Census Bureau’s 2019 1-year American Community Survey.
We used Trulia’s Rent vs. Buy Index as guide for specific price-to-rent ratio thresholds: a price-to-rent ratio of 1 to 15 indicates that buying is more favorable, a ratio of 16 to 20 indicates that renting is typically more favorable and a ratio of 21 or more indicates that renting is more favorable.
Tips for Managing Housing Costs
Consider expert help for your biggest money moves. If you need help deciding on whether to rent or buy, a financial advisor can guide you in making the smartest choice for housing. SmartAsset’s free tool matches you with financial advisors in five minutes. If you’re ready to connect with advisors, get matched now.
Budgeting is key. Whether you rent or buy, budgeting is crucial to set and reach your housing goals. Use SmartAsset’s budgeting tool to start saving now.
Don’t brush off those closing costs. If you buy, don’t forget to factor in closing costs when figuring out your total expenses.
Questions about our study? Contact press@smartasset.com.
Photo credit: ©iStock.com/martin-dm
The post Price-to-Rent Ratio in the 50 Largest U.S. Cities – 2021 Edition appeared first on SmartAsset Blog.
