Price & Time: Critical Couple of Days for the Equity Markets
This publication attempts to further explore the concept that mass movements of human psychology, as represented by the financial markets, are subject to the mathematical laws of nature and through the use of various geometric, arithmetic, statistical and cyclical techniques a better understanding of markets and their corresponding movements can be achieved.
To receive other reports from this author via e-mail, sign up to Kristian’s e-mail distribution list via this link.
Foreign Exchange Price & Time at a Glance:
USD/JPY:
Charts Created using Marketscope – Prepared by Kristian Kerr
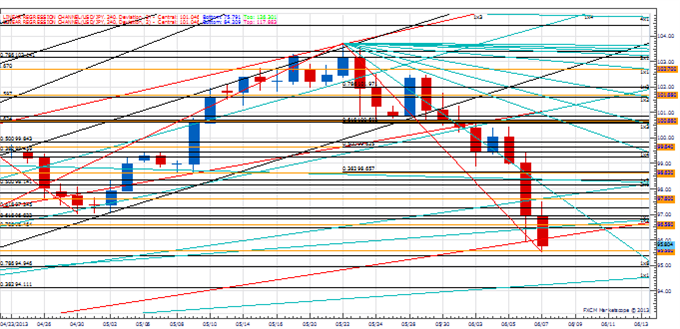
-USD/JPY has come under aggressive downside pressure over the past few days to trade to its lowest level since early April
-Our bias is lower, but caution is required as the exchange rate nears critical support in the form of the 8th square root progression of the year-to-date high near 95.55
-A close below this level is needed to maintain the downside tack and expose supports at 94.95 and below
-Near-term cycle studies suggest the next turn window of importance will be the second half of next week
-The 6th square root progression of the year-to-date high at 97.55 is key resistance and only strength above this level improves the technical picture and turns us positive on the dollar
Strategy: Accelerated lower on the break of cyclical “time support”. Like short positions while the rate is below 97.55.
GBP/USD:
Charts Created using Marketscope – Prepared by Kristian Kerr
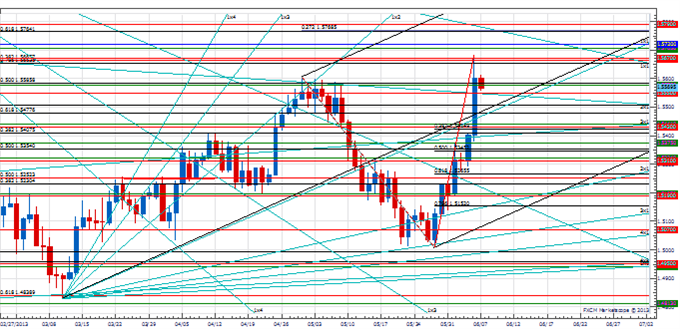
-GBP/USD accelerated higher on Thursday to trade to its highest levels since mid-February
-Our bias remains higher in Cable, but strong overhead resistance in the form of the 7th square root progression of the year-to date low at 1.5670 and the 100% projection March to May advance at 1.5720 warrants some caution
-Near-term cycles suggest the next couple of days are a potential turn window
-The 6th square root progression of the year-to-date low at 1.5550 is immediate support
-However, only clear weakness below the Gann/Fibonacci confluence at 1.5425/45 turns us negative
Strategy: Like holding small longs in Cable while the rate is above 1.5425.
NZD/USD:
Charts Created using Marketscope – Prepared by Kristian Kerr
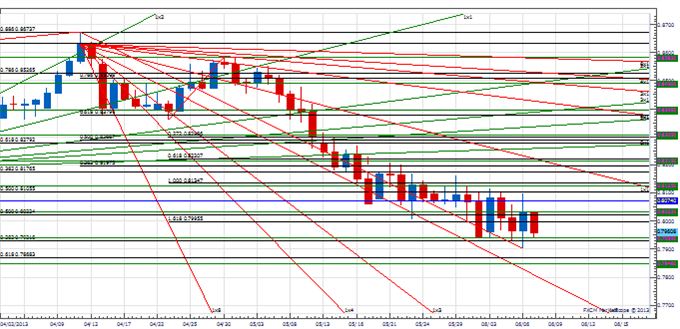
-NZD/USD continues to consolidate around the 8th square root progression of the year-to-date high in the .7940 area
-While below the 6th square root progression of the year’s high at .8125 our bias will be lower in the Bird
-Weakness below .7940 now needed to setup a further decline towards .7840/70
-A Gann related cyclical turn window will be in effect around the second half of next week
-The .8035 area is immediate resistance, but only a close over .8130 improves the negative technical structure and turns us positive on the Kiwi
Strategy: Like holding short positions while the Kiwi is below .8125, but also like reducing them around this important support zone. Potential for a turn of some sort next week is high.
Focus Chart of the Day: S&P 500
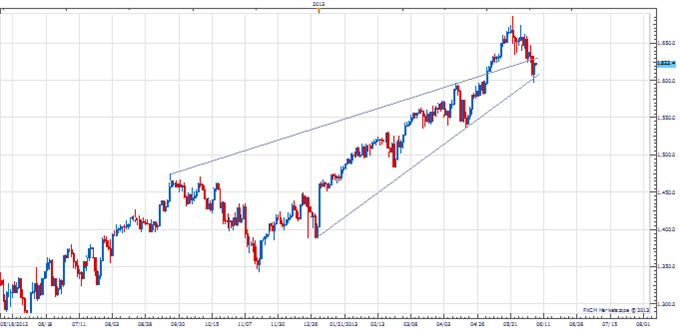
The latter half of the month looks very significant for the S&P 500 from a cyclical perspective. Whether this cyclical focal point becomes an important high or low likely depends on what happens over the next few sessions. On Thursday the index tested and briefly undercut critical Gann support at 1605 (2nd square root progression of 1687 high). Such action suggests the index is attempting to resume the broader uptrend and trade higher into the June 20-25 turn window. A close over 1630 would help to further confirm this notion. On the downside, Thursday’s 1597 low now becomes a key pivot. Any ‘surprise’ weakness below this level would catch many participants off guard and confirm a deeper immediate decline and pave the way for a further and potentially severe move lower into the latter half of the month.
--- Written by Kristian Kerr, Senior Currency Strategist for DailyFX.com
Looking for a way to pinpoint sentiment extremes in the Yen in real time? Try the Speculative Sentiment Index.
To contact Kristian, e-mail kkerr@fxcm.com. Follow me on Twitter @KKerrFX
DailyFX provides forex news and technical analysis on the trends that influence the global currency markets.
Learn forex trading with a free practice account and trading charts from FXCM.


