Can Public Service Enterprise Group Incorporated’s (NYSE:PEG) ROE Continue To Surpass The Industry Average?

Many investors are still learning about the various metrics that can be useful when analysing a stock. This article is for those who would like to learn about Return On Equity (ROE). We’ll use ROE to examine Public Service Enterprise Group Incorporated (NYSE:PEG), by way of a worked example.
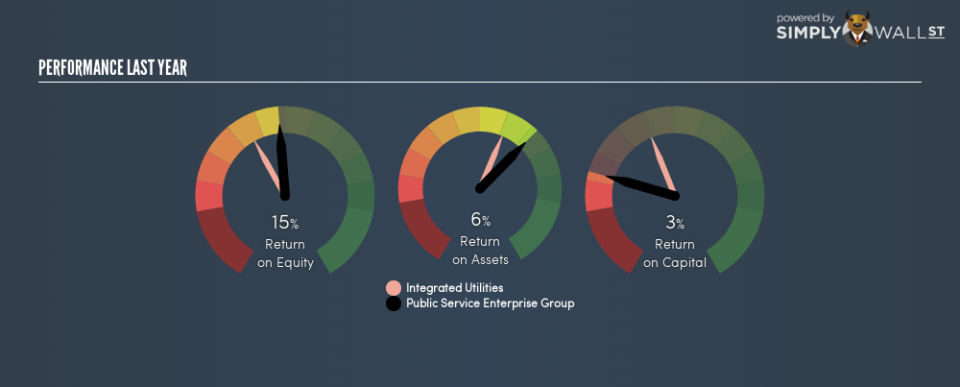
Our data shows Public Service Enterprise Group has a return on equity of 15% for the last year. Another way to think of that is that for every $1 worth of equity in the company, it was able to earn $0.15.
View our latest analysis for Public Service Enterprise Group
How Do You Calculate ROE?
The formula for ROE is:
Return on Equity = Net Profit ÷ Shareholders’ Equity
Or for Public Service Enterprise Group:
15% = 2195 ÷ US$14b (Based on the trailing twelve months to September 2018.)
It’s easy to understand the ‘net profit’ part of that equation, but ‘shareholders’ equity’ requires further explanation. It is all earnings retained by the company, plus any capital paid in by shareholders. The easiest way to calculate shareholders’ equity is to subtract the company’s total liabilities from the total assets.
What Does ROE Mean?
ROE looks at the amount a company earns relative to the money it has kept within the business. The ‘return’ is the profit over the last twelve months. The higher the ROE, the more profit the company is making. So, all else being equal, a high ROE is better than a low one. That means ROE can be used to compare two businesses.
Does Public Service Enterprise Group Have A Good ROE?
Arguably the easiest way to assess company’s ROE is to compare it with the average in its industry. The limitation of this approach is that some companies are quite different from others, even within the same industry classification. Pleasingly, Public Service Enterprise Group has a superior ROE than the average (11%) company in the integrated utilities industry.
That is a good sign. We think a high ROE, alone, is usually enough to justify further research into a company. For example you might check if insiders are buying shares.
How Does Debt Impact Return On Equity?
Companies usually need to invest money to grow their profits. That cash can come from retained earnings, issuing new shares (equity), or debt. In the first and second cases, the ROE will reflect this use of cash for investment in the business. In the latter case, the debt used for growth will improve returns, but won’t affect the total equity. Thus the use of debt can improve ROE, albeit along with extra risk in the case of stormy weather, metaphorically speaking.
Public Service Enterprise Group’s Debt And Its 15% ROE
Public Service Enterprise Group does use a significant amount of debt to increase returns. It has a debt to equity ratio of 1.03. Its ROE is quite good but, it would have probably been lower without the use of debt. Debt does bring some extra risk, so it’s only really worthwhile when a company generates some decent returns from it.
The Bottom Line On ROE
Return on equity is one way we can compare the business quality of different companies. In my book the highest quality companies have high return on equity, despite low debt. If two companies have around the same level of debt to equity, and one has a higher ROE, I’d generally prefer the one with higher ROE.
Having said that, while ROE is a useful indicator of business quality, you’ll have to look at a whole range of factors to determine the right price to buy a stock. It is important to consider other factors, such as future profit growth — and how much investment is required going forward. So you might want to check this FREE visualization of analyst forecasts for the company.
If you would prefer check out another company — one with potentially superior financials — then do not miss this free list of interesting companies, that have HIGH return on equity and low debt.
To help readers see past the short term volatility of the financial market, we aim to bring you a long-term focused research analysis purely driven by fundamental data. Note that our analysis does not factor in the latest price-sensitive company announcements.
The author is an independent contributor and at the time of publication had no position in the stocks mentioned. For errors that warrant correction please contact the editor at editorial-team@simplywallst.com.
