Pulling back 3.8% this week, Eaton's NYSE:ETN) five-year decline in earnings may be coming into investors focus
The most you can lose on any stock (assuming you don't use leverage) is 100% of your money. But when you pick a company that is really flourishing, you can make more than 100%. For instance, the price of Eaton Corporation plc (NYSE:ETN) stock is up an impressive 103% over the last five years. On the other hand, the stock price has retraced 3.8% in the last week. But note that the broader market is down 3.7% since last week, and this may have impacted Eaton's share price.
Although Eaton has shed US$2.5b from its market cap this week, let's take a look at its longer term fundamental trends and see if they've driven returns.
View our latest analysis for Eaton
To quote Buffett, 'Ships will sail around the world but the Flat Earth Society will flourish. There will continue to be wide discrepancies between price and value in the marketplace...' By comparing earnings per share (EPS) and share price changes over time, we can get a feel for how investor attitudes to a company have morphed over time.
Eaton's earnings per share are down 2.0% per year, despite strong share price performance over five years.
By glancing at these numbers, we'd posit that the decline in earnings per share is not representative of how the business has changed over the years. Since the change in EPS doesn't seem to correlate with the change in share price, it's worth taking a look at other metrics.
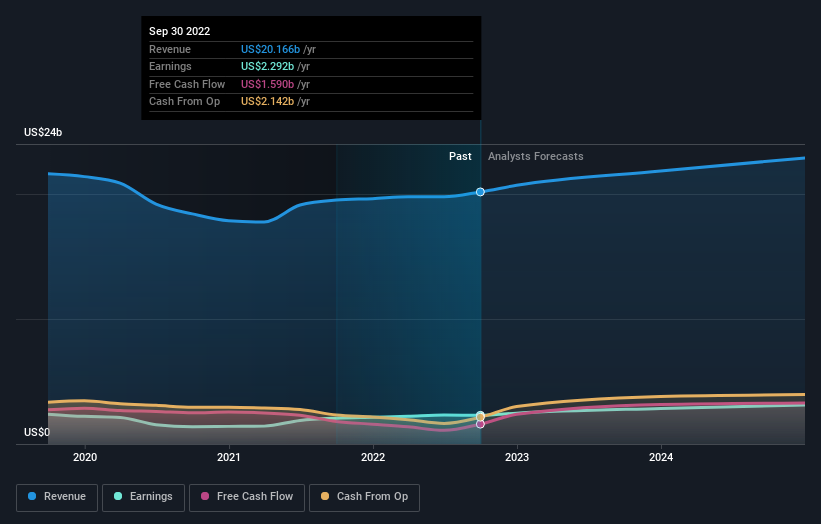
The revenue reduction of 2.1% per year is not a positive. So it seems one might have to take closer look at earnings and revenue trends to see how they might influence the share price.
You can see how earnings and revenue have changed over time in the image below (click on the chart to see the exact values).
Eaton is well known by investors, and plenty of clever analysts have tried to predict the future profit levels. Given we have quite a good number of analyst forecasts, it might be well worth checking out this free chart depicting consensus estimates.
What About Dividends?
When looking at investment returns, it is important to consider the difference between total shareholder return (TSR) and share price return. The TSR is a return calculation that accounts for the value of cash dividends (assuming that any dividend received was reinvested) and the calculated value of any discounted capital raisings and spin-offs. Arguably, the TSR gives a more comprehensive picture of the return generated by a stock. In the case of Eaton, it has a TSR of 134% for the last 5 years. That exceeds its share price return that we previously mentioned. The dividends paid by the company have thusly boosted the total shareholder return.
A Different Perspective
While it's certainly disappointing to see that Eaton shares lost 5.4% throughout the year, that wasn't as bad as the market loss of 20%. Longer term investors wouldn't be so upset, since they would have made 19%, each year, over five years. In the best case scenario the last year is just a temporary blip on the journey to a brighter future. I find it very interesting to look at share price over the long term as a proxy for business performance. But to truly gain insight, we need to consider other information, too. Case in point: We've spotted 2 warning signs for Eaton you should be aware of.
For those who like to find winning investments this free list of growing companies with recent insider purchasing, could be just the ticket.
Please note, the market returns quoted in this article reflect the market weighted average returns of stocks that currently trade on US exchanges.
Have feedback on this article? Concerned about the content? Get in touch with us directly. Alternatively, email editorial-team (at) simplywallst.com.
This article by Simply Wall St is general in nature. We provide commentary based on historical data and analyst forecasts only using an unbiased methodology and our articles are not intended to be financial advice. It does not constitute a recommendation to buy or sell any stock, and does not take account of your objectives, or your financial situation. We aim to bring you long-term focused analysis driven by fundamental data. Note that our analysis may not factor in the latest price-sensitive company announcements or qualitative material. Simply Wall St has no position in any stocks mentioned.
Join A Paid User Research Session
You’ll receive a US$30 Amazon Gift card for 1 hour of your time while helping us build better investing tools for the individual investors like yourself. Sign up here
