Will Pure Technologies Ltd (TSE:PUR) Continue To Underperform Its Industry?

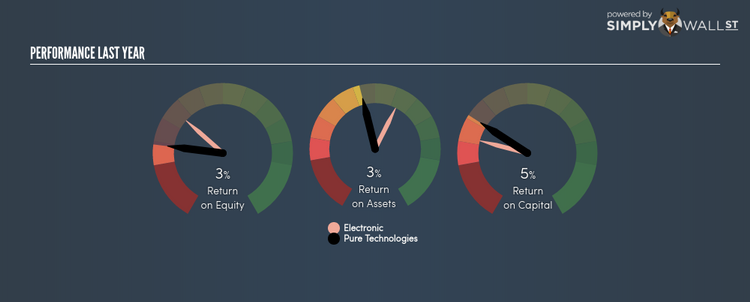
Pure Technologies Ltd’s (TSX:PUR) most recent return on equity was a substandard 2.75% relative to its industry performance of 8.23% over the past year. An investor may attribute an inferior ROE to a relatively inefficient performance, and whilst this can often be the case, knowing the nuts and bolts of the ROE calculation may change that perspective and give you a deeper insight into PUR’s past performance. Today I will look at how components such as financial leverage can influence ROE which may impact the sustainability of PUR’s returns. View our latest analysis for Pure Technologies
Breaking down ROE — the mother of all ratios
Return on Equity (ROE) weighs Pure Technologies’s profit against the level of its shareholders’ equity. It essentially shows how much the company can generate in earnings given the amount of equity it has raised. In most cases, a higher ROE is preferred; however, there are many other factors we must consider prior to making any investment decisions.
Return on Equity = Net Profit ÷ Shareholders Equity
ROE is measured against cost of equity in order to determine the efficiency of Pure Technologies’s equity capital deployed. Its cost of equity is 9.04%. Given a discrepancy of -6.29% between return and cost, this indicated that Pure Technologies may be paying more for its capital than what it’s generating in return. ROE can be split up into three useful ratios: net profit margin, asset turnover, and financial leverage. This is called the Dupont Formula:
Dupont Formula
ROE = profit margin × asset turnover × financial leverage
ROE = (annual net profit ÷ sales) × (sales ÷ assets) × (assets ÷ shareholders’ equity)
ROE = annual net profit ÷ shareholders’ equity
Basically, profit margin measures how much of revenue trickles down into earnings which illustrates how efficient the business is with its cost management. Asset turnover shows how much revenue Pure Technologies can generate with its current asset base. Finally, financial leverage will be our main focus today. It shows how much of assets are funded by equity and can show how sustainable the company’s capital structure is. Since ROE can be inflated by excessive debt, we need to examine Pure Technologies’s debt-to-equity level. Currently, Pure Technologies has no debt which means its returns are driven purely by equity capital. This could explain why Pure Technologies’s’ ROE is lower than its industry peers, most of which may have some degree of debt in its business.

What this means for you:
Are you a shareholder? PUR’s below-industry ROE is disappointing, furthermore, its returns were not even high enough to cover its own cost of equity. Since its existing ROE is not fuelled by unsustainable debt, investors shouldn’t give up as PUR still has capacity to improve shareholder returns by borrowing to invest in new projects in the future. If you’re looking for new ideas for high-returning stocks, you should take a look at our free platform to see the list of stocks with Return on Equity over 20%.
Are you a potential investor? If PUR has been on your watch list for a while, making an investment decision based on ROE alone is unwise. I recommend you do additional fundamental analysis by looking through our most recent infographic report on Pure Technologies to help you make a more informed investment decision.
To help readers see pass the short term volatility of the financial market, we aim to bring you a long-term focused research analysis purely driven by fundamental data. Note that our analysis does not factor in the latest price sensitive company announcements.
The author is an independent contributor and at the time of publication had no position in the stocks mentioned.
