After Q2 Earnings Misses, ExxonMobil And Chevron Look To Avoid the Same In Q3

Energy prices are in the midst of a multi-year turnaround, continuing to climb so far in 2018. While that has boded well for industry revenues and profits, it hasn’t translated into share-price gains for some of the oil and gas giants.
The latest update from the supermajors is scheduled for tomorrow morning, when ExxonMobil Corporation (NYSE: XOM) and Chevron Corporation (NYSE: CVX) are due to report earnings.
Both XOM and CVX have seen substantial recoveries in their top and bottom-line performance alongside the recovery in energy prices. But for different reasons both missed analyst estimates in their last report and their stocks have both underperformed in 2018.
On a macro level, economic growth still remains strong in many countries, including the U.S. and China, which could help continue to support energy demand as long as there aren’t any major slowdowns. Geopolitics, as they usually do, have been throwing some uncertainty into the outlook for oil prices. OPEC has been reportedly ramping up production to offset declines from Venezuela and Iran, while President Trump has increasingly called on OPEC to lower prices.
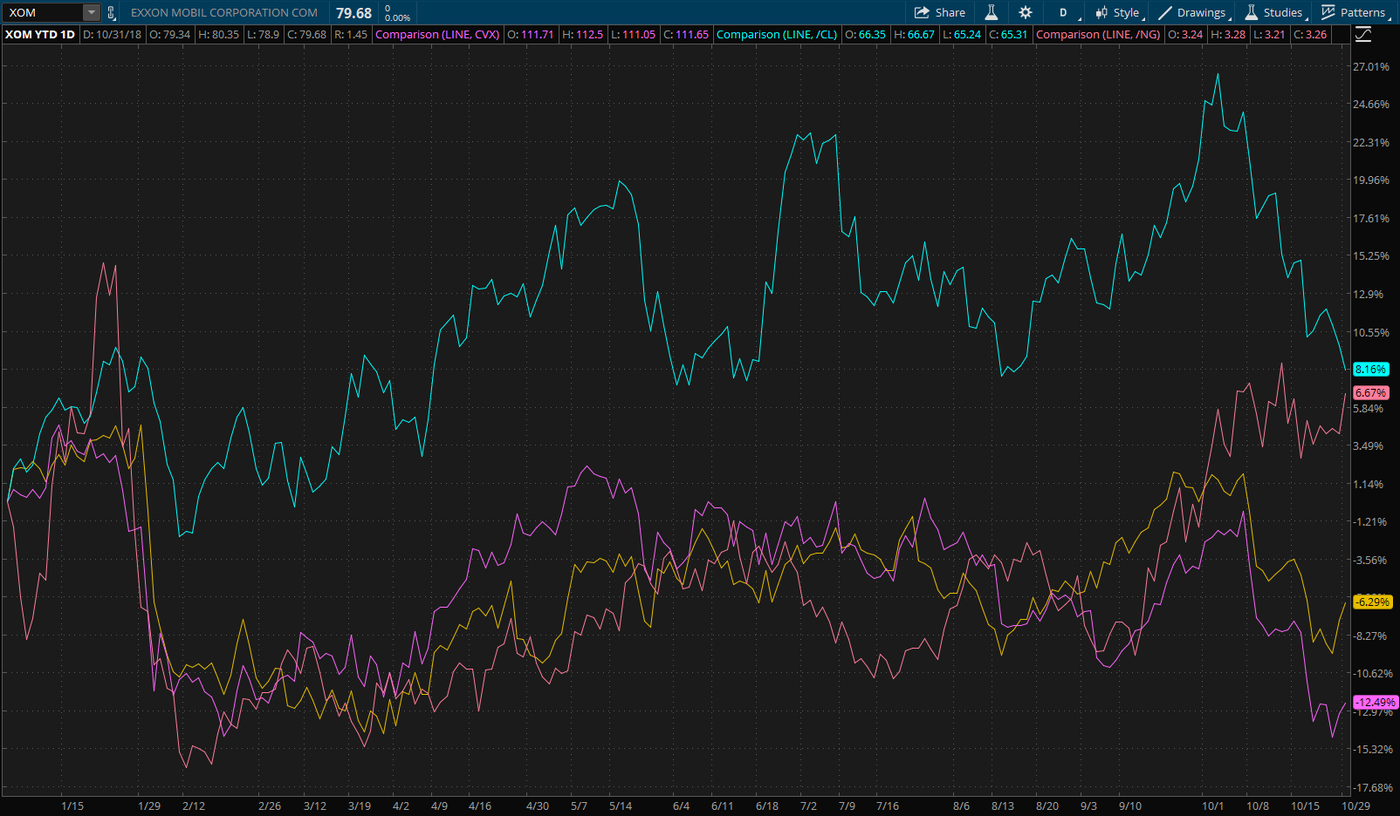
Diverging Performances. Energy stocks typically move in line with energy prices, however, there has been a greater divergence at times this year. ExxonMobil (XOM, yellow line) and Chevron (CVX, pink line) are down 6.29 percent and 6.29 percent year to date, respectively. At the same time, WTI crude oil futures (/CL, teal line) and natural gas futures (/NG, red line) are up 8.16 and 6.67 percent, respectively. Chart source: thinkorswim® by TD Ameritrade. Not a recommendation. For illustrative purposes only. Past performance does not guarantee future results.
ExxonMobil Earnings Options Activity
For Q3, XOM is expected to report adjusted EPS of $1.23, up from $0.93, on revenue of $73.55 billion, according to third-party consensus analyst estimates. Revenue is projected to increase 11.2 percent year over year.
XOM’s earnings have missed analyst estimates in the past two quarters. In its most recent report, adjusted EPS came in 33 cents below the $1.25 Wall Street was expecting. A large driver of that miss was maintenance and ongoing operational problems in the refinery business, which senior vice president Neil Chapman said “We are not happy about it.”
In Q2, XOM’s downstream decreased by $661 million, dropping almost in half to $724 million. Downtime and maintenance, some planned and some unplanned according to the company, were the biggest driver of the declines, accounting for $620 million of the drop. Unfavorable shifts in foreign exchange also negatively impacted earnings in this segment by $240 million.
On the other hand, earnings in XOM’s upstream operations increased by $1.9 billion thanks to a $2.38 billion jump from higher prices that offset declines from downtime/maintenance and lower production in the segment.
The chemical business was also another contributor to the earnings miss. Earnings in this segment decreased by $95 million to $890 million, which management said was a result of lower margins thanks to higher feed and energy costs.
Around XOM’s earnings report, options traders have priced in a 2.1 percent stock move in either direction, according to the Market Maker Move indicator on the thinkorswim® platform. Implied volatility is on the higher end, at the 81st percentile.
In short-term trading at the Nov. 2 weekly expiration, more of the activity for both calls and puts has been concentrated at the 79.5 and 80 strike prices. With those options expiring the same day as the report, most traders seem to be favoring the at-the-money strikes.
A few weeks out at the Nov. 16 monthly expiration, recent trading for calls has been heavier at the 82.5 strike price, with a decent amount of activity at the 85 strike, where the stock was trading at the end of September and beginning of October. On the put side, both the 77.5 and 80 strike price have been more active in recent sessions.
Note: Call options represent the right, but not the obligation, to buy the underlying security at a predetermined price over a set period of time. Put options represent the right, but not the obligation to sell the underlying security at a predetermined price over a set period of time.
Chevron Earnings and Options Activity
For Q3, CVX is expected to report adjusted EPS of $2.06 on revenue of $46.67 billion, according to third-party consensus analyst estimates. In the same quarter last year, adjusted EPS was $0.85 on revenue of $36.2 billion.
CVX also missed top and bottom-line analyst estimates in its last report. One factor was a $724 million charge related to higher interest expense, a one-off charge that analysts and management have both indicated they don’t expect will carry over into this quarter.
Another reason was a large decline in CVX’s international downstream operations. In Q2, CVX reported that this segmented generated $181 million in earnings, down from $561 million in the prior-year quarter. Management attributed a majority of this drop to lower margins on refined product sales.
Around tomorrow’s earnings report, options traders have priced in a 2.3 percent stock move in either direction, according to the Market Maker Move indicator. Implied volatility was at the 69th percentile as of this morning.
In short-term trading at the Nov. 2 weekly expiration, there hasn’t been much activity that stands out. On the call side, there has been some trading right round the money, whereas there has been a smattering of activity spread out across a range of strikes on the put side.
Looking at the Nov. 16 monthly expiration, calls have been active at the 115 and 120 strike prices in recent trading. On the put side, the 110 strike has been more active. Otherwise, most of the activity on the put side has been spread out.
Information from TDA is not intended to be investment advice or construed as a recommendation or endorsement of any particular investment or investment strategy, and is for illustrative purposes only. Be sure to understand all risks involved with each strategy, including commission costs, before attempting to place any trade.
See more from Benzinga
© 2018 Benzinga.com. Benzinga does not provide investment advice. All rights reserved.
