Has Raven Industries, Inc. (NASDAQ:RAVN) Been Employing Capital Shrewdly?

Today we are going to look at Raven Industries, Inc. (NASDAQ:RAVN) to see whether it might be an attractive investment prospect. In particular, we'll consider its Return On Capital Employed (ROCE), as that can give us insight into how profitably the company is able to employ capital in its business.
First, we'll go over how we calculate ROCE. Next, we'll compare it to others in its industry. Last but not least, we'll look at what impact its current liabilities have on its ROCE.
Understanding Return On Capital Employed (ROCE)
ROCE is a measure of a company's yearly pre-tax profit (its return), relative to the capital employed in the business. Generally speaking a higher ROCE is better. In brief, it is a useful tool, but it is not without drawbacks. Renowned investment researcher Michael Mauboussin has suggested that a high ROCE can indicate that 'one dollar invested in the company generates value of more than one dollar'.
How Do You Calculate Return On Capital Employed?
Analysts use this formula to calculate return on capital employed:
Return on Capital Employed = Earnings Before Interest and Tax (EBIT) ÷ (Total Assets - Current Liabilities)
Or for Raven Industries:
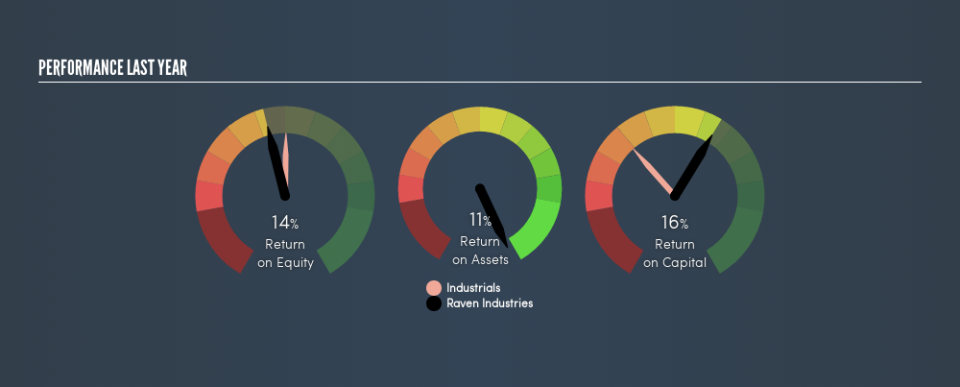
0.16 = US$53m ÷ (US$374m - US$38m) (Based on the trailing twelve months to April 2019.)
So, Raven Industries has an ROCE of 16%.
View our latest analysis for Raven Industries
Is Raven Industries's ROCE Good?
ROCE can be useful when making comparisons, such as between similar companies. Using our data, Raven Industries's ROCE appears to be around the 16% average of the Industrials industry. Separate from Raven Industries's performance relative to its industry, its ROCE in absolute terms looks satisfactory, and it may be worth researching in more depth.
Our data shows that Raven Industries currently has an ROCE of 16%, compared to its ROCE of 7.0% 3 years ago. This makes us wonder if the company is improving. You can click on the image below to see (in greater detail) how Raven Industries's past growth compares to other companies.
When considering ROCE, bear in mind that it reflects the past and does not necessarily predict the future. Companies in cyclical industries can be difficult to understand using ROCE, as returns typically look high during boom times, and low during busts. ROCE is only a point-in-time measure. Future performance is what matters, and you can see analyst predictions in our free report on analyst forecasts for the company.
How Raven Industries's Current Liabilities Impact Its ROCE
Short term (or current) liabilities, are things like supplier invoices, overdrafts, or tax bills that need to be paid within 12 months. The ROCE equation subtracts current liabilities from capital employed, so a company with a lot of current liabilities appears to have less capital employed, and a higher ROCE than otherwise. To counteract this, we check if a company has high current liabilities, relative to its total assets.
Raven Industries has total assets of US$374m and current liabilities of US$38m. Therefore its current liabilities are equivalent to approximately 10% of its total assets. Current liabilities are minimal, limiting the impact on ROCE.
What We Can Learn From Raven Industries's ROCE
With that in mind, Raven Industries's ROCE appears pretty good. Raven Industries shapes up well under this analysis, but it is far from the only business delivering excellent numbers . You might also want to check this free collection of companies delivering excellent earnings growth.
I will like Raven Industries better if I see some big insider buys. While we wait, check out this free list of growing companies with considerable, recent, insider buying.
We aim to bring you long-term focused research analysis driven by fundamental data. Note that our analysis may not factor in the latest price-sensitive company announcements or qualitative material.
If you spot an error that warrants correction, please contact the editor at editorial-team@simplywallst.com. This article by Simply Wall St is general in nature. It does not constitute a recommendation to buy or sell any stock, and does not take account of your objectives, or your financial situation. Simply Wall St has no position in the stocks mentioned. Thank you for reading.
