Read This Before You Buy 1300SMILES Limited (ASX:ONT) Because Of Its P/E Ratio

The goal of this article is to teach you how to use price to earnings ratios (P/E ratios). We'll apply a basic P/E ratio analysis to 1300SMILES Limited's (ASX:ONT), to help you decide if the stock is worth further research. 1300SMILES has a P/E ratio of 18.98, based on the last twelve months. That is equivalent to an earnings yield of about 5.3%.
See our latest analysis for 1300SMILES
How Do You Calculate A P/E Ratio?
The formula for price to earnings is:
Price to Earnings Ratio = Price per Share ÷ Earnings per Share (EPS)
Or for 1300SMILES:
P/E of 18.98 = AUD6.23 ÷ AUD0.33 (Based on the trailing twelve months to June 2019.)
Is A High Price-to-Earnings Ratio Good?
A higher P/E ratio implies that investors pay a higher price for the earning power of the business. That is not a good or a bad thing per se, but a high P/E does imply buyers are optimistic about the future.
How Does 1300SMILES's P/E Ratio Compare To Its Peers?
One good way to get a quick read on what market participants expect of a company is to look at its P/E ratio. As you can see below 1300SMILES has a P/E ratio that is fairly close for the average for the healthcare industry, which is 19.6.
Its P/E ratio suggests that 1300SMILES shareholders think that in the future it will perform about the same as other companies in its industry classification. So if 1300SMILES actually outperforms its peers going forward, that should be a positive for the share price. Further research into factors such as insider buying and selling, could help you form your own view on whether that is likely.
How Growth Rates Impact P/E Ratios
P/E ratios primarily reflect market expectations around earnings growth rates. Earnings growth means that in the future the 'E' will be higher. Therefore, even if you pay a high multiple of earnings now, that multiple will become lower in the future. So while a stock may look expensive based on past earnings, it could be cheap based on future earnings.
1300SMILES's earnings per share were pretty steady over the last year. But it has grown its earnings per share by 9.3% per year over the last five years.
A Limitation: P/E Ratios Ignore Debt and Cash In The Bank
It's important to note that the P/E ratio considers the market capitalization, not the enterprise value. Thus, the metric does not reflect cash or debt held by the company. In theory, a company can lower its future P/E ratio by using cash or debt to invest in growth.
While growth expenditure doesn't always pay off, the point is that it is a good option to have; but one that the P/E ratio ignores.
How Does 1300SMILES's Debt Impact Its P/E Ratio?
1300SMILES's net debt is 5.8% of its market cap. So it doesn't have as many options as it would with net cash, but its debt would not have much of an impact on its P/E ratio.
The Verdict On 1300SMILES's P/E Ratio
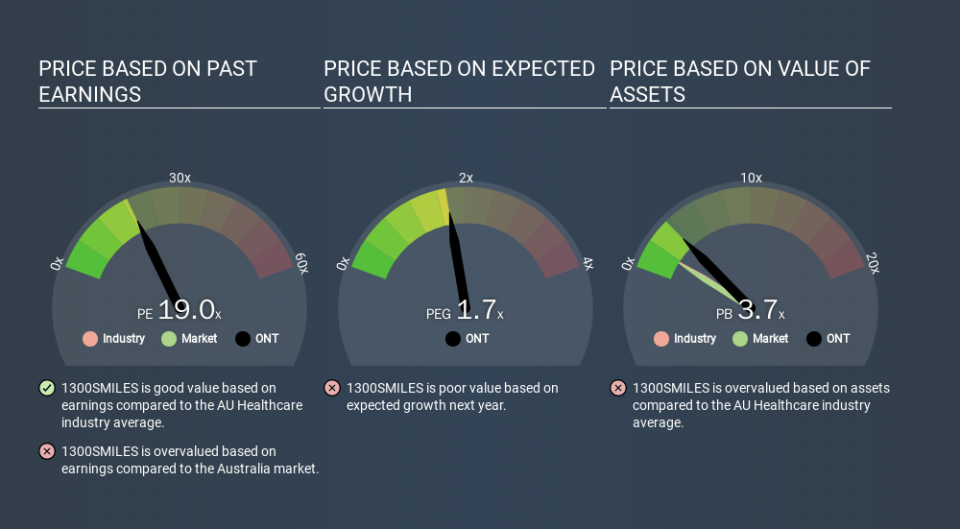
1300SMILES has a P/E of 19.0. That's around the same as the average in the AU market, which is 18.7. With modest debt and some recent earnings growth, it seems likely the market expects a steady performance going forward.
Investors should be looking to buy stocks that the market is wrong about. As value investor Benjamin Graham famously said, 'In the short run, the market is a voting machine but in the long run, it is a weighing machine. So this free visual report on analyst forecasts could hold the key to an excellent investment decision.
Of course you might be able to find a better stock than 1300SMILES. So you may wish to see this free collection of other companies that have grown earnings strongly.
If you spot an error that warrants correction, please contact the editor at editorial-team@simplywallst.com. This article by Simply Wall St is general in nature. It does not constitute a recommendation to buy or sell any stock, and does not take account of your objectives, or your financial situation. Simply Wall St has no position in the stocks mentioned.
We aim to bring you long-term focused research analysis driven by fundamental data. Note that our analysis may not factor in the latest price-sensitive company announcements or qualitative material. Thank you for reading.
