Read This Before You Buy American Woodmark Corporation (NASDAQ:AMWD) Because Of Its P/E Ratio

The goal of this article is to teach you how to use price to earnings ratios (P/E ratios). To keep it practical, we'll show how American Woodmark Corporation's (NASDAQ:AMWD) P/E ratio could help you assess the value on offer. American Woodmark has a price to earnings ratio of 19.91, based on the last twelve months. That is equivalent to an earnings yield of about 5.0%.
View our latest analysis for American Woodmark
How Do You Calculate A P/E Ratio?
The formula for P/E is:
Price to Earnings Ratio = Share Price ÷ Earnings per Share (EPS)
Or for American Woodmark:
P/E of 19.91 = $105.04 ÷ $5.28 (Based on the year to October 2019.)
Is A High Price-to-Earnings Ratio Good?
A higher P/E ratio implies that investors pay a higher price for the earning power of the business. That isn't necessarily good or bad, but a high P/E implies relatively high expectations of what a company can achieve in the future.
How Does American Woodmark's P/E Ratio Compare To Its Peers?
One good way to get a quick read on what market participants expect of a company is to look at its P/E ratio. The image below shows that American Woodmark has a lower P/E than the average (21.9) P/E for companies in the building industry.
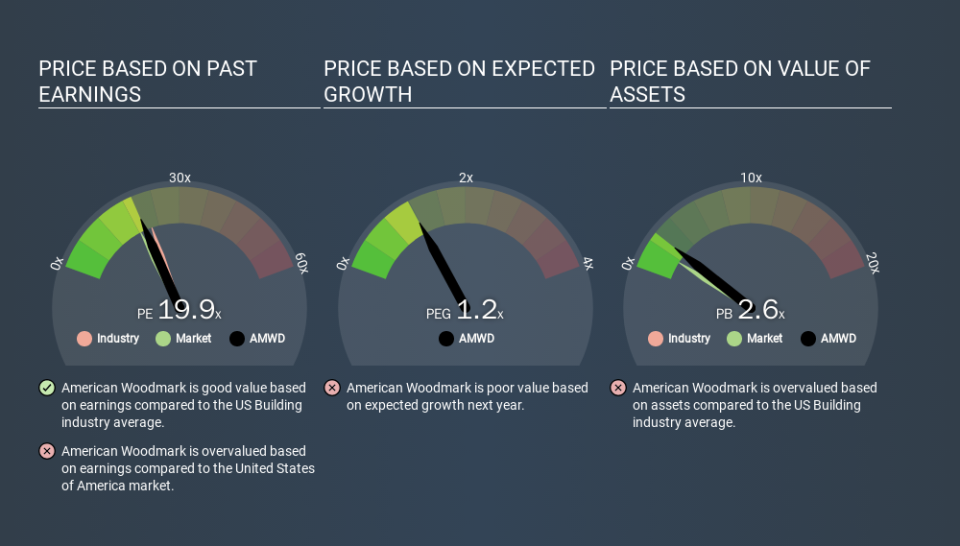
This suggests that market participants think American Woodmark will underperform other companies in its industry. Many investors like to buy stocks when the market is pessimistic about their prospects. It is arguably worth checking if insiders are buying shares, because that might imply they believe the stock is undervalued.
How Growth Rates Impact P/E Ratios
Probably the most important factor in determining what P/E a company trades on is the earnings growth. That's because companies that grow earnings per share quickly will rapidly increase the 'E' in the equation. Therefore, even if you pay a high multiple of earnings now, that multiple will become lower in the future. So while a stock may look expensive based on past earnings, it could be cheap based on future earnings.
It's nice to see that American Woodmark grew EPS by a stonking 42% in the last year. And it has bolstered its earnings per share by 26% per year over the last five years. I'd therefore be a little surprised if its P/E ratio was not relatively high.
A Limitation: P/E Ratios Ignore Debt and Cash In The Bank
One drawback of using a P/E ratio is that it considers market capitalization, but not the balance sheet. Thus, the metric does not reflect cash or debt held by the company. Hypothetically, a company could reduce its future P/E ratio by spending its cash (or taking on debt) to achieve higher earnings.
Spending on growth might be good or bad a few years later, but the point is that the P/E ratio does not account for the option (or lack thereof).
So What Does American Woodmark's Balance Sheet Tell Us?
American Woodmark has net debt equal to 31% of its market cap. You'd want to be aware of this fact, but it doesn't bother us.
The Verdict On American Woodmark's P/E Ratio
American Woodmark's P/E is 19.9 which is above average (18.3) in its market. Its debt levels do not imperil its balance sheet and its EPS growth is very healthy indeed. So on this analysis a high P/E ratio seems reasonable.
Investors should be looking to buy stocks that the market is wrong about. As value investor Benjamin Graham famously said, 'In the short run, the market is a voting machine but in the long run, it is a weighing machine. So this free visual report on analyst forecasts could hold the key to an excellent investment decision.
You might be able to find a better buy than American Woodmark. If you want a selection of possible winners, check out this free list of interesting companies that trade on a P/E below 20 (but have proven they can grow earnings).
If you spot an error that warrants correction, please contact the editor at editorial-team@simplywallst.com. This article by Simply Wall St is general in nature. It does not constitute a recommendation to buy or sell any stock, and does not take account of your objectives, or your financial situation. Simply Wall St has no position in the stocks mentioned.
We aim to bring you long-term focused research analysis driven by fundamental data. Note that our analysis may not factor in the latest price-sensitive company announcements or qualitative material. Thank you for reading.
