Read This Before You Buy Applied Industrial Technologies, Inc. (NYSE:AIT) Because Of Its P/E Ratio

Today, we'll introduce the concept of the P/E ratio for those who are learning about investing. We'll apply a basic P/E ratio analysis to Applied Industrial Technologies, Inc.'s (NYSE:AIT), to help you decide if the stock is worth further research. Applied Industrial Technologies has a price to earnings ratio of 15.5, based on the last twelve months. That means that at current prices, buyers pay $15.5 for every $1 in trailing yearly profits.
Check out our latest analysis for Applied Industrial Technologies
How Do You Calculate A P/E Ratio?
The formula for P/E is:
Price to Earnings Ratio = Share Price ÷ Earnings per Share (EPS)
Or for Applied Industrial Technologies:
P/E of 15.5 = $57.89 ÷ $3.74 (Based on the year to March 2019.)
Is A High Price-to-Earnings Ratio Good?
A higher P/E ratio means that investors are paying a higher price for each $1 of company earnings. All else being equal, it's better to pay a low price -- but as Warren Buffett said, 'It's far better to buy a wonderful company at a fair price than a fair company at a wonderful price.'
How Does Applied Industrial Technologies's P/E Ratio Compare To Its Peers?
The P/E ratio indicates whether the market has higher or lower expectations of a company. You can see in the image below that the average P/E (15.9) for companies in the trade distributors industry is roughly the same as Applied Industrial Technologies's P/E.
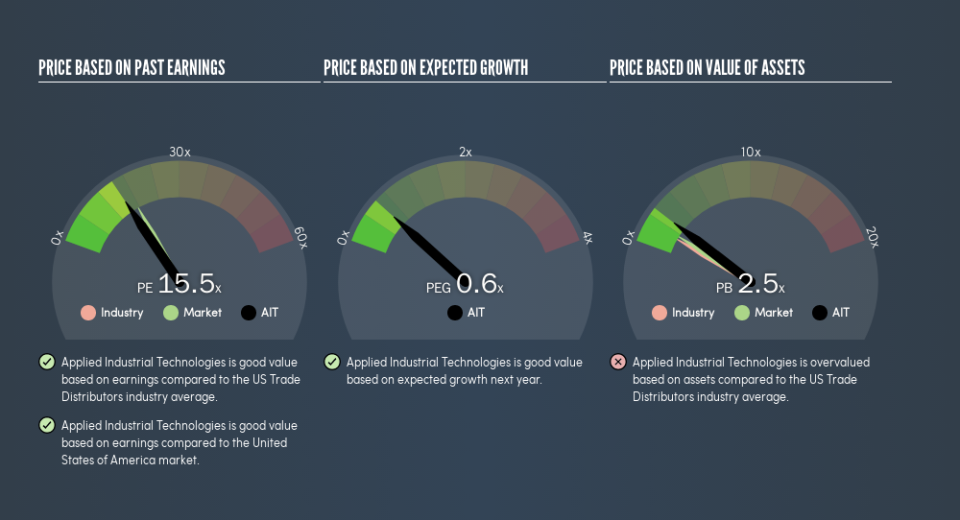
Its P/E ratio suggests that Applied Industrial Technologies shareholders think that in the future it will perform about the same as other companies in its industry classification. So if Applied Industrial Technologies actually outperforms its peers going forward, that should be a positive for the share price. I would further inform my view by checking insider buying and selling., among other things.
How Growth Rates Impact P/E Ratios
Probably the most important factor in determining what P/E a company trades on is the earnings growth. That's because companies that grow earnings per share quickly will rapidly increase the 'E' in the equation. Therefore, even if you pay a high multiple of earnings now, that multiple will become lower in the future. Then, a lower P/E should attract more buyers, pushing the share price up.
Applied Industrial Technologies shrunk earnings per share by 5.9% last year. But EPS is up 6.4% over the last 5 years.
A Limitation: P/E Ratios Ignore Debt and Cash In The Bank
Don't forget that the P/E ratio considers market capitalization. So it won't reflect the advantage of cash, or disadvantage of debt. In theory, a company can lower its future P/E ratio by using cash or debt to invest in growth.
Such expenditure might be good or bad, in the long term, but the point here is that the balance sheet is not reflected by this ratio.
So What Does Applied Industrial Technologies's Balance Sheet Tell Us?
Net debt is 42% of Applied Industrial Technologies's market cap. While it's worth keeping this in mind, it isn't a worry.
The Bottom Line On Applied Industrial Technologies's P/E Ratio
Applied Industrial Technologies has a P/E of 15.5. That's below the average in the US market, which is 17.5. With only modest debt, it's likely the lack of EPS growth at least partially explains the pessimism implied by the P/E ratio.
Investors have an opportunity when market expectations about a stock are wrong. As value investor Benjamin Graham famously said, 'In the short run, the market is a voting machine but in the long run, it is a weighing machine.' So this free visual report on analyst forecasts could hold the key to an excellent investment decision.
But note: Applied Industrial Technologies may not be the best stock to buy. So take a peek at this free list of interesting companies with strong recent earnings growth (and a P/E ratio below 20).
We aim to bring you long-term focused research analysis driven by fundamental data. Note that our analysis may not factor in the latest price-sensitive company announcements or qualitative material.
If you spot an error that warrants correction, please contact the editor at editorial-team@simplywallst.com. This article by Simply Wall St is general in nature. It does not constitute a recommendation to buy or sell any stock, and does not take account of your objectives, or your financial situation. Simply Wall St has no position in the stocks mentioned. Thank you for reading.
