Read This Before You Buy Crew Energy Inc. (TSE:CR) Because Of Its P/E Ratio

This article is written for those who want to get better at using price to earnings ratios (P/E ratios). We’ll show how you can use Crew Energy Inc.’s (TSE:CR) P/E ratio to inform your assessment of the investment opportunity. Crew Energy has a P/E ratio of 12.16, based on the last twelve months. That means that at current prices, buyers pay CA$12.16 for every CA$1 in trailing yearly profits.
Check out our latest analysis for Crew Energy
How Do I Calculate A Price To Earnings Ratio?
The formula for price to earnings is:
Price to Earnings Ratio = Share Price ÷ Earnings per Share (EPS)
Or for Crew Energy:
P/E of 12.16 = CA$1.03 ÷ CA$0.085 (Based on the trailing twelve months to December 2018.)
Is A High Price-to-Earnings Ratio Good?
A higher P/E ratio means that investors are paying a higher price for each CA$1 of company earnings. That is not a good or a bad thing per se, but a high P/E does imply buyers are optimistic about the future.
How Growth Rates Impact P/E Ratios
Probably the most important factor in determining what P/E a company trades on is the earnings growth. When earnings grow, the ‘E’ increases, over time. Therefore, even if you pay a high multiple of earnings now, that multiple will become lower in the future. So while a stock may look expensive based on past earnings, it could be cheap based on future earnings.
Crew Energy’s earnings per share fell by 63% in the last twelve months. But over the longer term (5 years) earnings per share have increased by 60%.
How Does Crew Energy’s P/E Ratio Compare To Its Peers?
The P/E ratio indicates whether the market has higher or lower expectations of a company. If you look at the image below, you can see Crew Energy has a lower P/E than the average (15.4) in the oil and gas industry classification.
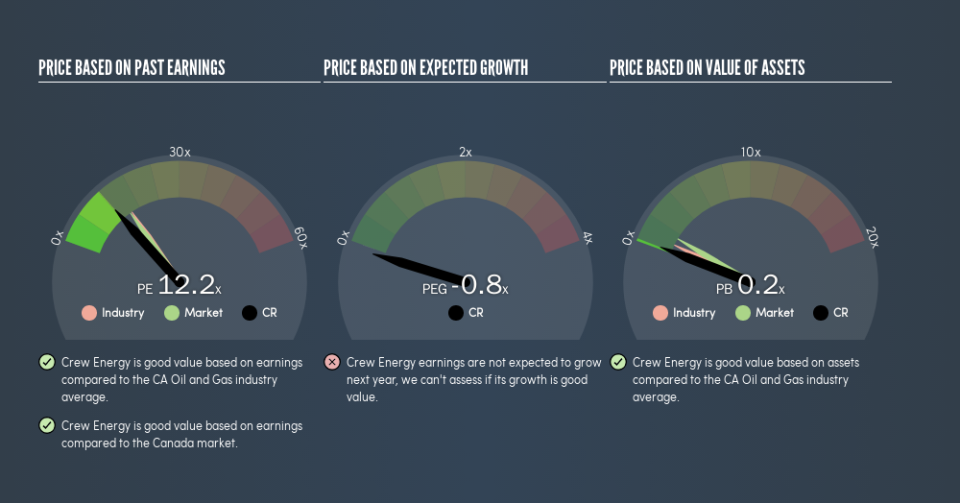
Crew Energy’s P/E tells us that market participants think it will not fare as well as its peers in the same industry. While current expectations are low, the stock could be undervalued if the situation is better than the market assumes. It is arguably worth checking if insiders are buying shares, because that might imply they believe the stock is undervalued.
A Limitation: P/E Ratios Ignore Debt and Cash In The Bank
The ‘Price’ in P/E reflects the market capitalization of the company. Thus, the metric does not reflect cash or debt held by the company. Hypothetically, a company could reduce its future P/E ratio by spending its cash (or taking on debt) to achieve higher earnings.
Such expenditure might be good or bad, in the long term, but the point here is that the balance sheet is not reflected by this ratio.
Crew Energy’s Balance Sheet
Net debt totals a substantial 219% of Crew Energy’s market cap. This is a relatively high level of debt, so the stock probably deserves a relatively low P/E ratio. Keep that in mind when comparing it to other companies.
The Bottom Line On Crew Energy’s P/E Ratio
Crew Energy has a P/E of 12.2. That’s below the average in the CA market, which is 15. The P/E reflects market pessimism that probably arises from the lack of recent EPS growth, paired with significant leverage.
Investors have an opportunity when market expectations about a stock are wrong. As value investor Benjamin Graham famously said, ‘In the short run, the market is a voting machine but in the long run, it is a weighing machine.’ So this free report on the analyst consensus forecasts could help you make a master move on this stock.
But note: Crew Energy may not be the best stock to buy. So take a peek at this free list of interesting companies with strong recent earnings growth (and a P/E ratio below 20).
We aim to bring you long-term focused research analysis driven by fundamental data. Note that our analysis may not factor in the latest price-sensitive company announcements or qualitative material.
If you spot an error that warrants correction, please contact the editor at editorial-team@simplywallst.com. This article by Simply Wall St is general in nature. It does not constitute a recommendation to buy or sell any stock, and does not take account of your objectives, or your financial situation. Simply Wall St has no position in the stocks mentioned. Thank you for reading.
