Read This Before You Buy FTI Consulting, Inc. (NYSE:FCN) Because Of Its P/E Ratio

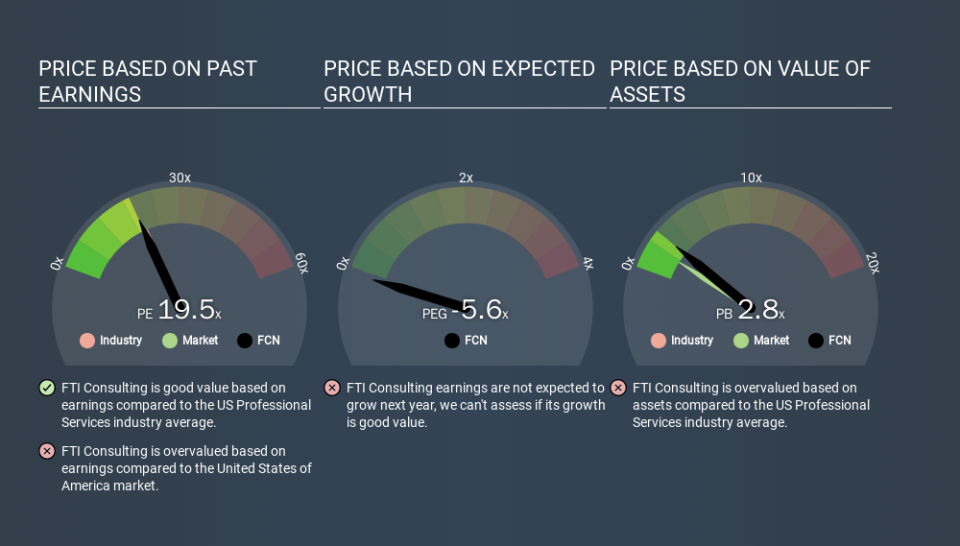
The goal of this article is to teach you how to use price to earnings ratios (P/E ratios). To keep it practical, we'll show how FTI Consulting, Inc.'s (NYSE:FCN) P/E ratio could help you assess the value on offer. Looking at earnings over the last twelve months, FTI Consulting has a P/E ratio of 19.47. That corresponds to an earnings yield of approximately 5.1%.
Check out our latest analysis for FTI Consulting
How Do You Calculate A P/E Ratio?
The formula for price to earnings is:
Price to Earnings Ratio = Share Price ÷ Earnings per Share (EPS)
Or for FTI Consulting:
P/E of 19.47 = $111.30 ÷ $5.72 (Based on the trailing twelve months to September 2019.)
Is A High Price-to-Earnings Ratio Good?
A higher P/E ratio means that buyers have to pay a higher price for each $1 the company has earned over the last year. That isn't necessarily good or bad, but a high P/E implies relatively high expectations of what a company can achieve in the future.
Does FTI Consulting Have A Relatively High Or Low P/E For Its Industry?
One good way to get a quick read on what market participants expect of a company is to look at its P/E ratio. As you can see below FTI Consulting has a P/E ratio that is fairly close for the average for the professional services industry, which is 20.4.
That indicates that the market expects FTI Consulting will perform roughly in line with other companies in its industry. The company could surprise by performing better than average, in the future. Checking factors such as director buying and selling. could help you form your own view on if that will happen.
How Growth Rates Impact P/E Ratios
Generally speaking the rate of earnings growth has a profound impact on a company's P/E multiple. When earnings grow, the 'E' increases, over time. That means unless the share price increases, the P/E will reduce in a few years. So while a stock may look expensive based on past earnings, it could be cheap based on future earnings.
FTI Consulting's earnings per share grew by -9.1% in the last twelve months. And it has bolstered its earnings per share by 35% per year over the last five years.
Remember: P/E Ratios Don't Consider The Balance Sheet
One drawback of using a P/E ratio is that it considers market capitalization, but not the balance sheet. Thus, the metric does not reflect cash or debt held by the company. In theory, a company can lower its future P/E ratio by using cash or debt to invest in growth.
Spending on growth might be good or bad a few years later, but the point is that the P/E ratio does not account for the option (or lack thereof).
So What Does FTI Consulting's Balance Sheet Tell Us?
FTI Consulting's net debt is 0.4% of its market cap. The market might award it a higher P/E ratio if it had net cash, but its unlikely this low level of net borrowing is having a big impact on the P/E multiple.
The Bottom Line On FTI Consulting's P/E Ratio
FTI Consulting has a P/E of 19.5. That's around the same as the average in the US market, which is 18.9. With modest debt and some recent earnings growth, it seems likely the market expects a steady performance going forward.
Investors should be looking to buy stocks that the market is wrong about. People often underestimate remarkable growth -- so investors can make money when fast growth is not fully appreciated. So this free report on the analyst consensus forecasts could help you make a master move on this stock.
Of course you might be able to find a better stock than FTI Consulting. So you may wish to see this free collection of other companies that have grown earnings strongly.
If you spot an error that warrants correction, please contact the editor at editorial-team@simplywallst.com. This article by Simply Wall St is general in nature. It does not constitute a recommendation to buy or sell any stock, and does not take account of your objectives, or your financial situation. Simply Wall St has no position in the stocks mentioned.
We aim to bring you long-term focused research analysis driven by fundamental data. Note that our analysis may not factor in the latest price-sensitive company announcements or qualitative material. Thank you for reading.
