Read This Before You Buy General Dynamics Corporation (NYSE:GD) Because Of Its P/E Ratio

The goal of this article is to teach you how to use price to earnings ratios (P/E ratios). To keep it practical, we’ll show how General Dynamics Corporation’s (NYSE:GD) P/E ratio could help you assess the value on offer. General Dynamics has a P/E ratio of 14.97, based on the last twelve months. That is equivalent to an earnings yield of about 6.7%.
View our latest analysis for General Dynamics
How Do I Calculate General Dynamics’s Price To Earnings Ratio?
The formula for P/E is:
Price to Earnings Ratio = Share Price ÷ Earnings per Share (EPS)
Or for General Dynamics:
P/E of 14.97 = $170.22 ÷ $11.37 (Based on the year to December 2018.)
Is A High Price-to-Earnings Ratio Good?
A higher P/E ratio means that buyers have to pay a higher price for each $1 the company has earned over the last year. All else being equal, it’s better to pay a low price — but as Warren Buffett said, ‘It’s far better to buy a wonderful company at a fair price than a fair company at a wonderful price.’
How Growth Rates Impact P/E Ratios
Probably the most important factor in determining what P/E a company trades on is the earnings growth. That’s because companies that grow earnings per share quickly will rapidly increase the ‘E’ in the equation. That means unless the share price increases, the P/E will reduce in a few years. Then, a lower P/E should attract more buyers, pushing the share price up.
It’s great to see that General Dynamics grew EPS by 17% in the last year. And it has bolstered its earnings per share by 7.4% per year over the last five years. This could arguably justify a relatively high P/E ratio.
How Does General Dynamics’s P/E Ratio Compare To Its Peers?
We can get an indication of market expectations by looking at the P/E ratio. If you look at the image below, you can see General Dynamics has a lower P/E than the average (20.8) in the aerospace & defense industry classification.
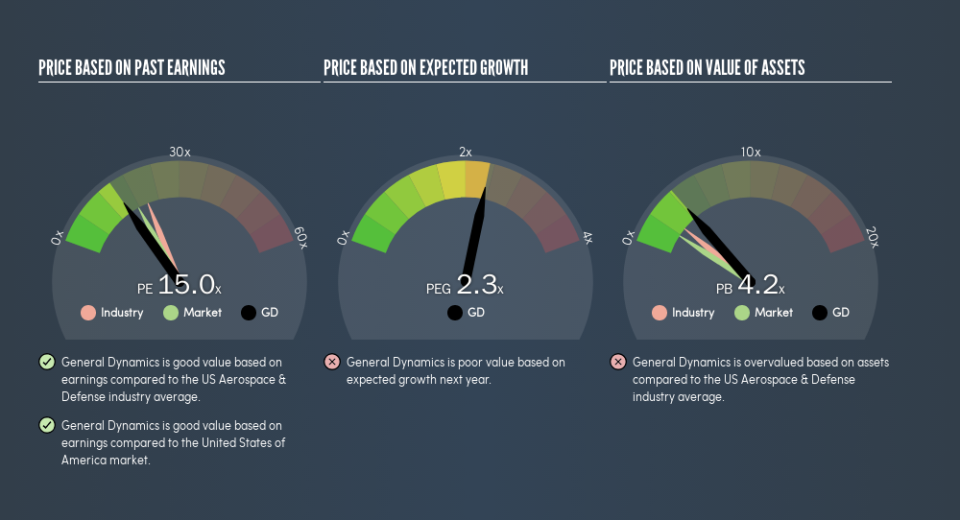
Its relatively low P/E ratio indicates that General Dynamics shareholders think it will struggle to do as well as other companies in its industry classification. While current expectations are low, the stock could be undervalued if the situation is better than the market assumes. It is arguably worth checking if insiders are buying shares, because that might imply they believe the stock is undervalued.
A Limitation: P/E Ratios Ignore Debt and Cash In The Bank
Don’t forget that the P/E ratio considers market capitalization. That means it doesn’t take debt or cash into account. In theory, a company can lower its future P/E ratio by using cash or debt to invest in growth.
Such spending might be good or bad, overall, but the key point here is that you need to look at debt to understand the P/E ratio in context.
Is Debt Impacting General Dynamics’s P/E?
General Dynamics’s net debt is 23% of its market cap. This could bring some additional risk, and reduce the number of investment options for management; worth remembering if you compare its P/E to businesses without debt.
The Bottom Line On General Dynamics’s P/E Ratio
General Dynamics trades on a P/E ratio of 15, which is below the US market average of 17.6. The company hasn’t stretched its balance sheet, and earnings growth was good last year. The low P/E ratio suggests current market expectations are muted, implying these levels of growth will not continue.
When the market is wrong about a stock, it gives savvy investors an opportunity. If the reality for a company is not as bad as the P/E ratio indicates, then the share price should increase as the market realizes this. So this free visualization of the analyst consensus on future earnings could help you make the right decision about whether to buy, sell, or hold.
Of course, you might find a fantastic investment by looking at a few good candidates. So take a peek at this free list of companies with modest (or no) debt, trading on a P/E below 20.
We aim to bring you long-term focused research analysis driven by fundamental data. Note that our analysis may not factor in the latest price-sensitive company announcements or qualitative material.
If you spot an error that warrants correction, please contact the editor at editorial-team@simplywallst.com. This article by Simply Wall St is general in nature. It does not constitute a recommendation to buy or sell any stock, and does not take account of your objectives, or your financial situation. Simply Wall St has no position in the stocks mentioned. Thank you for reading.
