Read This Before You Buy Kingsmen Creatives Ltd. (SGX:5MZ) Because Of Its P/E Ratio

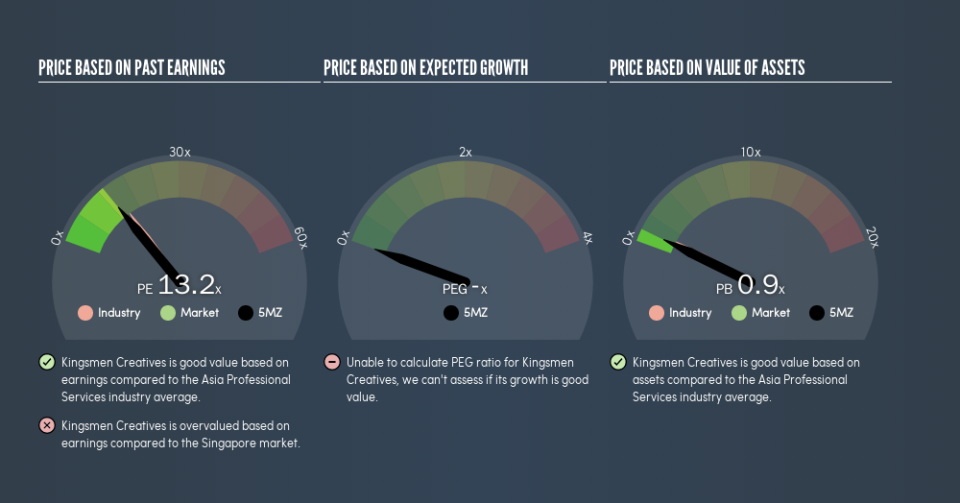
Today, we'll introduce the concept of the P/E ratio for those who are learning about investing. We'll apply a basic P/E ratio analysis to Kingsmen Creatives Ltd.'s (SGX:5MZ), to help you decide if the stock is worth further research. Kingsmen Creatives has a price to earnings ratio of 13.2, based on the last twelve months. That is equivalent to an earnings yield of about 7.6%.
See our latest analysis for Kingsmen Creatives
How Do I Calculate A Price To Earnings Ratio?
The formula for price to earnings is:
Price to Earnings Ratio = Price per Share ÷ Earnings per Share (EPS)
Or for Kingsmen Creatives:
P/E of 13.2 = SGD0.53 ÷ SGD0.040 (Based on the year to March 2019.)
Is A High Price-to-Earnings Ratio Good?
A higher P/E ratio means that buyers have to pay a higher price for each SGD1 the company has earned over the last year. That isn't necessarily good or bad, but a high P/E implies relatively high expectations of what a company can achieve in the future.
How Does Kingsmen Creatives's P/E Ratio Compare To Its Peers?
We can get an indication of market expectations by looking at the P/E ratio. If you look at the image below, you can see Kingsmen Creatives has a lower P/E than the average (14.7) in the professional services industry classification.
Its relatively low P/E ratio indicates that Kingsmen Creatives shareholders think it will struggle to do as well as other companies in its industry classification. Many investors like to buy stocks when the market is pessimistic about their prospects. If you consider the stock interesting, further research is recommended. For example, I often monitor director buying and selling.
How Growth Rates Impact P/E Ratios
Companies that shrink earnings per share quickly will rapidly decrease the 'E' in the equation. That means unless the share price falls, the P/E will increase in a few years. A higher P/E should indicate the stock is expensive relative to others -- and that may encourage shareholders to sell.
Kingsmen Creatives saw earnings per share decrease by 19% last year. And over the longer term (5 years) earnings per share have decreased 14% annually. This growth rate might warrant a below average P/E ratio.
Remember: P/E Ratios Don't Consider The Balance Sheet
The 'Price' in P/E reflects the market capitalization of the company. So it won't reflect the advantage of cash, or disadvantage of debt. In theory, a company can lower its future P/E ratio by using cash or debt to invest in growth.
Such spending might be good or bad, overall, but the key point here is that you need to look at debt to understand the P/E ratio in context.
Is Debt Impacting Kingsmen Creatives's P/E?
Kingsmen Creatives has net cash of S$37m. This is fairly high at 35% of its market capitalization. That might mean balance sheet strength is important to the business, but should also help push the P/E a bit higher than it would otherwise be.
The Bottom Line On Kingsmen Creatives's P/E Ratio
Kingsmen Creatives's P/E is 13.2 which is about average (13) in the SG market. While the lack of recent growth is probably muting optimism, the relatively strong balance sheet will allow the company to weather a storm; so it isn't very surprising to see that it has a P/E ratio close to the market average.
Investors have an opportunity when market expectations about a stock are wrong. As value investor Benjamin Graham famously said, 'In the short run, the market is a voting machine but in the long run, it is a weighing machine.' We don't have analyst forecasts, but shareholders might want to examine this detailed historical graph of earnings, revenue and cash flow.
But note: Kingsmen Creatives may not be the best stock to buy. So take a peek at this free list of interesting companies with strong recent earnings growth (and a P/E ratio below 20).
We aim to bring you long-term focused research analysis driven by fundamental data. Note that our analysis may not factor in the latest price-sensitive company announcements or qualitative material.
If you spot an error that warrants correction, please contact the editor at editorial-team@simplywallst.com. This article by Simply Wall St is general in nature. It does not constitute a recommendation to buy or sell any stock, and does not take account of your objectives, or your financial situation. Simply Wall St has no position in the stocks mentioned. Thank you for reading.
