Read This Before You Buy Southwest Gas Holdings, Inc. (NYSE:SWX) Because Of Its P/E Ratio

This article is written for those who want to get better at using price to earnings ratios (P/E ratios). To keep it practical, we'll show how Southwest Gas Holdings, Inc.'s (NYSE:SWX) P/E ratio could help you assess the value on offer. Southwest Gas Holdings has a P/E ratio of 17.57, based on the last twelve months. That means that at current prices, buyers pay $17.57 for every $1 in trailing yearly profits.
See our latest analysis for Southwest Gas Holdings
How Do I Calculate A Price To Earnings Ratio?
The formula for price to earnings is:
Price to Earnings Ratio = Price per Share ÷ Earnings per Share (EPS)
Or for Southwest Gas Holdings:
P/E of 17.57 = $69.300 ÷ $3.944 (Based on the year to December 2019.)
(Note: the above calculation results may not be precise due to rounding.)
Is A High P/E Ratio Good?
A higher P/E ratio implies that investors pay a higher price for the earning power of the business. That isn't necessarily good or bad, but a high P/E implies relatively high expectations of what a company can achieve in the future.
How Does Southwest Gas Holdings's P/E Ratio Compare To Its Peers?
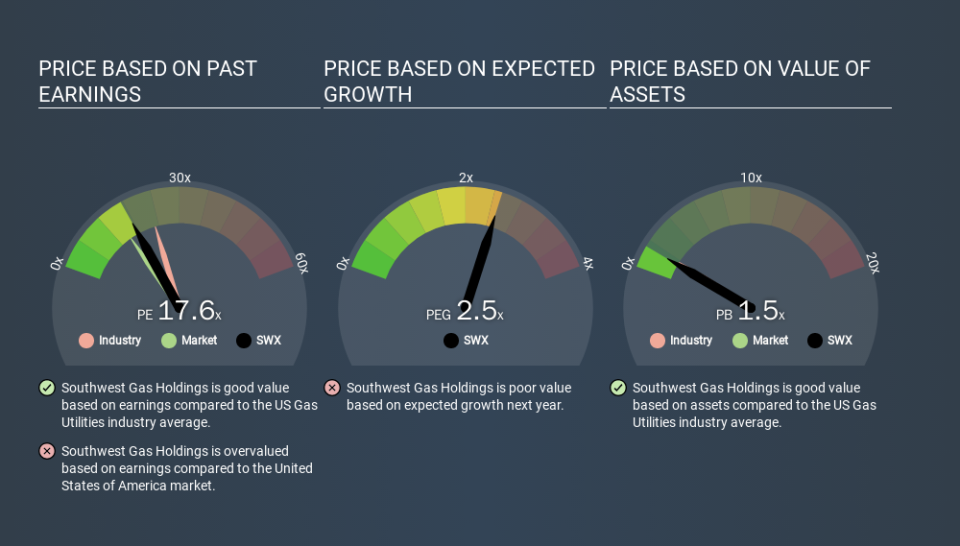
The P/E ratio essentially measures market expectations of a company. The image below shows that Southwest Gas Holdings has a lower P/E than the average (22.3) P/E for companies in the gas utilities industry.
Southwest Gas Holdings's P/E tells us that market participants think it will not fare as well as its peers in the same industry. While current expectations are low, the stock could be undervalued if the situation is better than the market assumes. You should delve deeper. I like to check if company insiders have been buying or selling.
How Growth Rates Impact P/E Ratios
P/E ratios primarily reflect market expectations around earnings growth rates. If earnings are growing quickly, then the 'E' in the equation will increase faster than it would otherwise. That means unless the share price increases, the P/E will reduce in a few years. So while a stock may look expensive based on past earnings, it could be cheap based on future earnings.
Southwest Gas Holdings saw earnings per share improve by -6.9% last year. And it has bolstered its earnings per share by 5.4% per year over the last five years.
A Limitation: P/E Ratios Ignore Debt and Cash In The Bank
It's important to note that the P/E ratio considers the market capitalization, not the enterprise value. That means it doesn't take debt or cash into account. Theoretically, a business can improve its earnings (and produce a lower P/E in the future) by investing in growth. That means taking on debt (or spending its cash).
Such spending might be good or bad, overall, but the key point here is that you need to look at debt to understand the P/E ratio in context.
Southwest Gas Holdings's Balance Sheet
Southwest Gas Holdings's net debt is 69% of its market cap. This is a reasonably significant level of debt -- all else being equal you'd expect a much lower P/E than if it had net cash.
The Bottom Line On Southwest Gas Holdings's P/E Ratio
Southwest Gas Holdings's P/E is 17.6 which is above average (15.3) in its market. With significant debt and fairly modest EPS growth last year, shareholders are betting on sustained improvement.
Investors should be looking to buy stocks that the market is wrong about. As value investor Benjamin Graham famously said, 'In the short run, the market is a voting machine but in the long run, it is a weighing machine. So this free visualization of the analyst consensus on future earnings could help you make the right decision about whether to buy, sell, or hold.
Of course you might be able to find a better stock than Southwest Gas Holdings. So you may wish to see this free collection of other companies that have grown earnings strongly.
If you spot an error that warrants correction, please contact the editor at editorial-team@simplywallst.com. This article by Simply Wall St is general in nature. It does not constitute a recommendation to buy or sell any stock, and does not take account of your objectives, or your financial situation. Simply Wall St has no position in the stocks mentioned.
We aim to bring you long-term focused research analysis driven by fundamental data. Note that our analysis may not factor in the latest price-sensitive company announcements or qualitative material. Thank you for reading.
