Read This Before Judging HKBN Ltd.'s (HKG:1310) ROE

One of the best investments we can make is in our own knowledge and skill set. With that in mind, this article will work through how we can use Return On Equity (ROE) to better understand a business. To keep the lesson grounded in practicality, we'll use ROE to better understand HKBN Ltd. (HKG:1310).
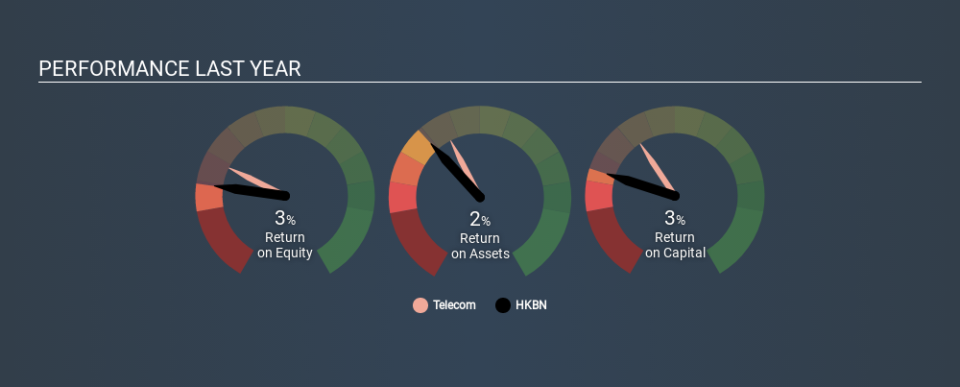
Our data shows HKBN has a return on equity of 2.9% for the last year. Another way to think of that is that for every HK$1 worth of equity in the company, it was able to earn HK$0.03.
See our latest analysis for HKBN
How Do You Calculate ROE?
The formula for return on equity is:
Return on Equity = Net Profit (from continuing operations) ÷ Shareholders' Equity
Or for HKBN:
2.9% = HK$215m ÷ HK$7.5b (Based on the trailing twelve months to August 2019.)
It's easy to understand the 'net profit' part of that equation, but 'shareholders' equity' requires further explanation. It is the capital paid in by shareholders, plus any retained earnings. Shareholders' equity can be calculated by subtracting the total liabilities of the company from the total assets of the company.
What Does ROE Signify?
ROE measures a company's profitability against the profit it retains, and any outside investments. The 'return' is the profit over the last twelve months. The higher the ROE, the more profit the company is making. So, all else being equal, a high ROE is better than a low one. That means it can be interesting to compare the ROE of different companies.
Does HKBN Have A Good Return On Equity?
By comparing a company's ROE with its industry average, we can get a quick measure of how good it is. The limitation of this approach is that some companies are quite different from others, even within the same industry classification. If you look at the image below, you can see HKBN has a lower ROE than the average (5.8%) in the Telecom industry classification.
Unfortunately, that's sub-optimal. It is better when the ROE is above industry average, but a low one doesn't necessarily mean the business is overpriced. Nonetheless, it might be wise to check if insiders have been selling.
How Does Debt Impact ROE?
Virtually all companies need money to invest in the business, to grow profits. That cash can come from issuing shares, retained earnings, or debt. In the case of the first and second options, the ROE will reflect this use of cash, for growth. In the latter case, the debt used for growth will improve returns, but won't affect the total equity. In this manner the use of debt will boost ROE, even though the core economics of the business stay the same.
HKBN's Debt And Its 2.9% ROE
HKBN clearly uses a significant amount of debt to boost returns, as it has a debt to equity ratio of 1.29. With a fairly low ROE, and significant use of debt, it's hard to get excited about this business at the moment. Debt increases risk and reduces options for the company in the future, so you generally want to see some good returns from using it.
The Key Takeaway
Return on equity is a useful indicator of the ability of a business to generate profits and return them to shareholders. Companies that can achieve high returns on equity without too much debt are generally of good quality. If two companies have around the same level of debt to equity, and one has a higher ROE, I'd generally prefer the one with higher ROE.
But when a business is high quality, the market often bids it up to a price that reflects this. The rate at which profits are likely to grow, relative to the expectations of profit growth reflected in the current price, must be considered, too. So you might want to check this FREE visualization of analyst forecasts for the company.
Of course, you might find a fantastic investment by looking elsewhere. So take a peek at this free list of interesting companies.
If you spot an error that warrants correction, please contact the editor at editorial-team@simplywallst.com. This article by Simply Wall St is general in nature. It does not constitute a recommendation to buy or sell any stock, and does not take account of your objectives, or your financial situation. Simply Wall St has no position in the stocks mentioned.
We aim to bring you long-term focused research analysis driven by fundamental data. Note that our analysis may not factor in the latest price-sensitive company announcements or qualitative material. Thank you for reading.
