Realogy Holdings Corp (NYSE:RLGY) Delivered A Better ROE Than The Industry, Here’s Why

Realogy Holdings Corp (NYSE:RLGY) delivered an ROE of 16.27% over the past 12 months, which is an impressive feat relative to its industry average of 10.58% during the same period. On the surface, this looks fantastic since we know that RLGY has made large profits from little equity capital; however, ROE doesn’t tell us if management have borrowed heavily to make this happen. We’ll take a closer look today at factors like financial leverage to determine whether RLGY’s ROE is actually sustainable. See our latest analysis for Realogy Holdings
What you must know about ROE
Return on Equity (ROE) is a measure of Realogy Holdings’s profit relative to its shareholders’ equity. For example, if the company invests $1 in the form of equity, it will generate $0.16 in earnings from this. Generally speaking, a higher ROE is preferred; however, there are other factors we must also consider before making any conclusions.
Return on Equity = Net Profit ÷ Shareholders Equity
ROE is assessed against cost of equity, which is measured using the Capital Asset Pricing Model (CAPM) – but let’s not dive into the details of that today. For now, let’s just look at the cost of equity number for Realogy Holdings, which is 12.44%. This means Realogy Holdings returns enough to cover its own cost of equity, with a buffer of 3.83%. This sustainable practice implies that the company pays less for its capital than what it generates in return. ROE can be split up into three useful ratios: net profit margin, asset turnover, and financial leverage. This is called the Dupont Formula:
Dupont Formula
ROE = profit margin × asset turnover × financial leverage
ROE = (annual net profit ÷ sales) × (sales ÷ assets) × (assets ÷ shareholders’ equity)
ROE = annual net profit ÷ shareholders’ equity
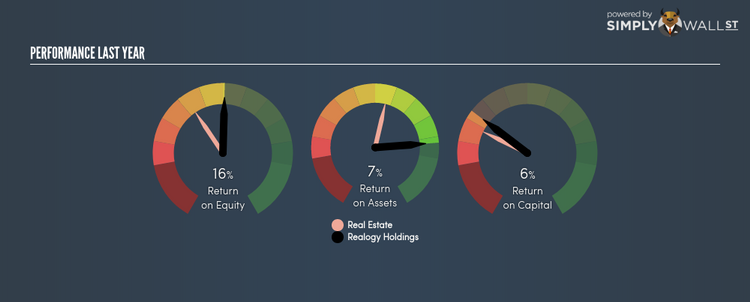
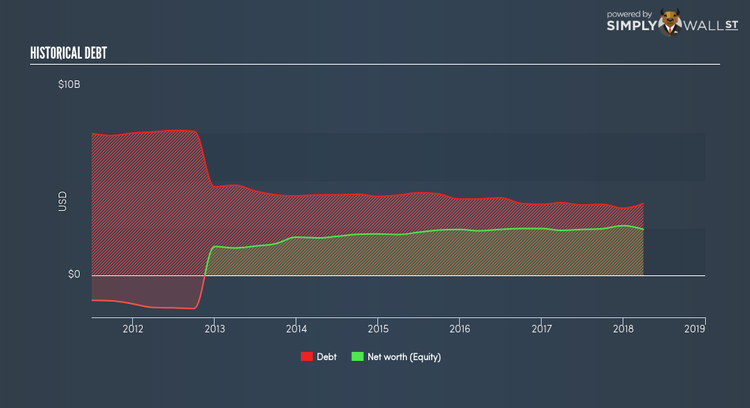
Basically, profit margin measures how much of revenue trickles down into earnings which illustrates how efficient the business is with its cost management. Asset turnover shows how much revenue Realogy Holdings can generate with its current asset base. The most interesting ratio, and reflective of sustainability of its ROE, is financial leverage. Since ROE can be inflated by excessive debt, we need to examine Realogy Holdings’s debt-to-equity level. Currently the debt-to-equity ratio stands at a high 155.89%, which means its above-average ROE is driven by significant debt levels.
Next Steps:
While ROE is a relatively simple calculation, it can be broken down into different ratios, each telling a different story about the strengths and weaknesses of a company. Realogy Holdings’s ROE is impressive relative to the industry average and also covers its cost of equity. With debt capital in excess of equity, ROE may be inflated by the use of debt funding, raising questions over the sustainability of the company’s returns. Although ROE can be a useful metric, it is only a small part of diligent research.
For Realogy Holdings, I’ve compiled three fundamental aspects you should look at:
Financial Health: Does it have a healthy balance sheet? Take a look at our free balance sheet analysis with six simple checks on key factors like leverage and risk.
Valuation: What is Realogy Holdings worth today? Is the stock undervalued, even when its growth outlook is factored into its intrinsic value? The intrinsic value infographic in our free research report helps visualize whether Realogy Holdings is currently mispriced by the market.
Other High-Growth Alternatives : Are there other high-growth stocks you could be holding instead of Realogy Holdings? Explore our interactive list of stocks with large growth potential to get an idea of what else is out there you may be missing!
To help readers see pass the short term volatility of the financial market, we aim to bring you a long-term focused research analysis purely driven by fundamental data. Note that our analysis does not factor in the latest price sensitive company announcements.
The author is an independent contributor and at the time of publication had no position in the stocks mentioned.
