With A Recent ROE Of 10.13%, Can Revolution Bars Group plc (LON:RBG) Catch Up To Its Industry?

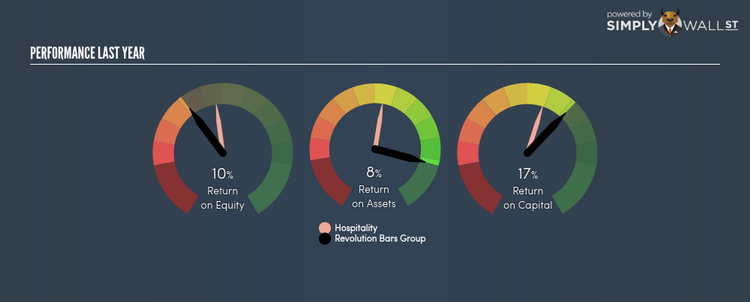
Revolution Bars Group plc’s (LSE:RBG) most recent return on equity was a substandard 10.13% relative to its industry performance of 14.76% over the past year. Though RBG’s recent performance is underwhelming, it is useful to understand what ROE is made up of and how it should be interpreted. Knowing these components can change your views on RBG’s below-average returns. Metrics such as financial leverage can impact the level of ROE which in turn can affect the sustainability of RBG’s returns. Let me show you what I mean by this. View our latest analysis for Revolution Bars Group
What you must know about ROE
Return on Equity (ROE) is a measure of Revolution Bars Group’s profit relative to its shareholders’ equity. It essentially shows how much the company can generate in earnings given the amount of equity it has raised. While a higher ROE is preferred in most cases, there are several other factors we should consider before drawing any conclusions.
Return on Equity = Net Profit ÷ Shareholders Equity
ROE is assessed against cost of equity, which is measured using the Capital Asset Pricing Model (CAPM) – but let’s not dive into the details of that today. For now, let’s just look at the cost of equity number for Revolution Bars Group, which is 8.30%. Some of Revolution Bars Group’s peers may have a higher ROE but its cost of equity could exceed this return, leading to an unsustainable negative discrepancy i.e. the company spends more than it earns. This is not the case for Revolution Bars Group which is reassuring. ROE can be broken down into three different ratios: net profit margin, asset turnover, and financial leverage. This is called the Dupont Formula:
Dupont Formula
ROE = profit margin × asset turnover × financial leverage
ROE = (annual net profit ÷ sales) × (sales ÷ assets) × (assets ÷ shareholders’ equity)
ROE = annual net profit ÷ shareholders’ equity
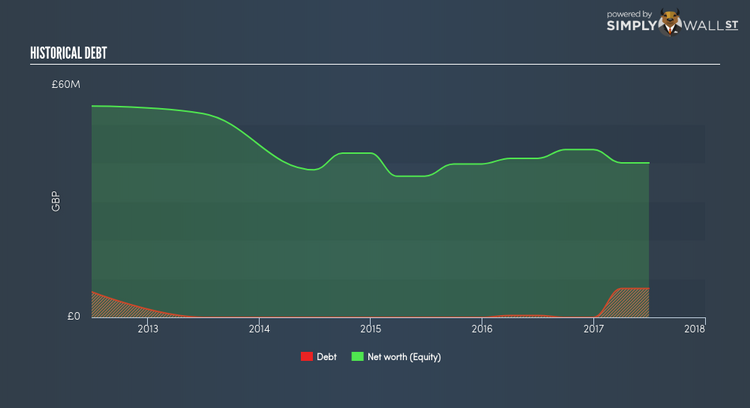
The first component is profit margin, which measures how much of sales is retained after the company pays for all its expenses. The other component, asset turnover, illustrates how much revenue Revolution Bars Group can make from its asset base. Finally, financial leverage will be our main focus today. It shows how much of assets are funded by equity and can show how sustainable the company’s capital structure is. Since financial leverage can artificially inflate ROE, we need to look at how much debt Revolution Bars Group currently has. Currently the debt-to-equity ratio stands at a low 18.75%, which means Revolution Bars Group still has headroom to take on more leverage in order to increase profits.
What this means for you:
Are you a shareholder? Even though RBG returned below the industry average, its ROE comes in excess of its cost of equity. Since its high ROE is not likely driven by high debt, it might be a good time to top up on your current holdings if your fundamental research reaffirms this analysis. If you’re looking for new ideas for high-returning stocks, you should take a look at our free platform to see the list of stocks with Return on Equity over 20%.
Are you a potential investor? If you are considering investing in RBG, basing your decision on ROE alone is certainly not sufficient. I recommend you do additional fundamental analysis by looking through our most recent infographic report on Revolution Bars Group to help you make a more informed investment decision.
To help readers see pass the short term volatility of the financial market, we aim to bring you a long-term focused research analysis purely driven by fundamental data. Note that our analysis does not factor in the latest price sensitive company announcements.
The author is an independent contributor and at the time of publication had no position in the stocks mentioned.
