Recent uptick might appease MongoDB, Inc. (NASDAQ:MDB) institutional owners after losing 56% over the past year
A look at the shareholders of MongoDB, Inc. (NASDAQ:MDB) can tell us which group is most powerful. We can see that institutions own the lion's share in the company with 82% ownership. That is, the group stands to benefit the most if the stock rises (or lose the most if there is a downturn).
Last week's US$1.1b market cap gain would probably be appreciated by institutional investors, especially after a year of 56% losses.
In the chart below, we zoom in on the different ownership groups of MongoDB.
Check out our latest analysis for MongoDB
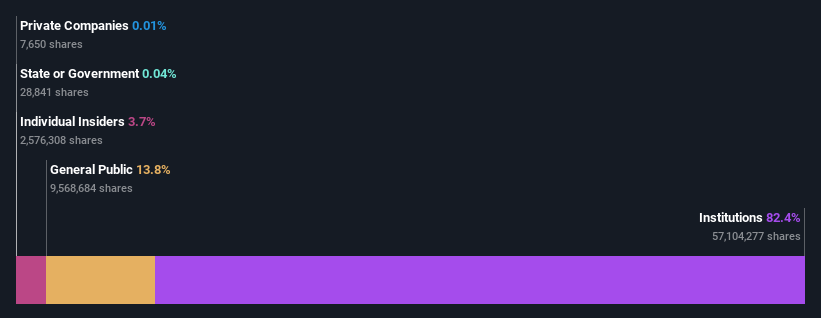
What Does The Institutional Ownership Tell Us About MongoDB?
Institutional investors commonly compare their own returns to the returns of a commonly followed index. So they generally do consider buying larger companies that are included in the relevant benchmark index.
MongoDB already has institutions on the share registry. Indeed, they own a respectable stake in the company. This can indicate that the company has a certain degree of credibility in the investment community. However, it is best to be wary of relying on the supposed validation that comes with institutional investors. They too, get it wrong sometimes. When multiple institutions own a stock, there's always a risk that they are in a 'crowded trade'. When such a trade goes wrong, multiple parties may compete to sell stock fast. This risk is higher in a company without a history of growth. You can see MongoDB's historic earnings and revenue below, but keep in mind there's always more to the story.

Institutional investors own over 50% of the company, so together than can probably strongly influence board decisions. We note that hedge funds don't have a meaningful investment in MongoDB. T. Rowe Price Group, Inc. is currently the company's largest shareholder with 10% of shares outstanding. In comparison, the second and third largest shareholders hold about 8.8% and 6.9% of the stock.
Looking at the shareholder registry, we can see that 51% of the ownership is controlled by the top 11 shareholders, meaning that no single shareholder has a majority interest in the ownership.
While studying institutional ownership for a company can add value to your research, it is also a good practice to research analyst recommendations to get a deeper understand of a stock's expected performance. Quite a few analysts cover the stock, so you could look into forecast growth quite easily.
Insider Ownership Of MongoDB
While the precise definition of an insider can be subjective, almost everyone considers board members to be insiders. Company management run the business, but the CEO will answer to the board, even if he or she is a member of it.
Insider ownership is positive when it signals leadership are thinking like the true owners of the company. However, high insider ownership can also give immense power to a small group within the company. This can be negative in some circumstances.
We can report that insiders do own shares in MongoDB, Inc.. It is a very large company, and board members collectively own US$543m worth of shares (at current prices). It is good to see this level of investment. You can check here to see if those insiders have been buying recently.
General Public Ownership
The general public-- including retail investors -- own 14% stake in the company, and hence can't easily be ignored. While this size of ownership may not be enough to sway a policy decision in their favour, they can still make a collective impact on company policies.
Next Steps:
I find it very interesting to look at who exactly owns a company. But to truly gain insight, we need to consider other information, too. Take risks for example - MongoDB has 4 warning signs we think you should be aware of.
If you would prefer discover what analysts are predicting in terms of future growth, do not miss this free report on analyst forecasts.
NB: Figures in this article are calculated using data from the last twelve months, which refer to the 12-month period ending on the last date of the month the financial statement is dated. This may not be consistent with full year annual report figures.
Have feedback on this article? Concerned about the content? Get in touch with us directly. Alternatively, email editorial-team (at) simplywallst.com.
This article by Simply Wall St is general in nature. We provide commentary based on historical data and analyst forecasts only using an unbiased methodology and our articles are not intended to be financial advice. It does not constitute a recommendation to buy or sell any stock, and does not take account of your objectives, or your financial situation. We aim to bring you long-term focused analysis driven by fundamental data. Note that our analysis may not factor in the latest price-sensitive company announcements or qualitative material. Simply Wall St has no position in any stocks mentioned.
Join A Paid User Research Session
You’ll receive a US$30 Amazon Gift card for 1 hour of your time while helping us build better investing tools for the individual investors like yourself. Sign up here
