Is Reckitt Benckiser Group plc’s (LON:RB.) Balance Sheet A Threat To Its Future?

Investors pursuing a solid, dependable stock investment can often be led to Reckitt Benckiser Group plc (LSE:RB.), a large-cap worth £47.87B. One reason being its ‘too big to fail’ aura which gives it the appearance of a strong and stable investment. But, the key to extending previous success is in the health of the company’s financials. This article will examine Reckitt Benckiser Group’s financial liquidity and debt levels to get an idea of whether the company can deal with cyclical downturns and maintain funds to accommodate strategic spending for future growth. Remember this is a very top-level look that focuses exclusively on financial health, so I recommend a deeper analysis into RB. here. See our latest analysis for Reckitt Benckiser Group
How much cash does RB. generate through its operations?
RB.’s debt level has been constant at around £2,389.0M over the previous year – this includes both the current and long-term debt. At this stable level of debt, RB. currently has £885.0M remaining in cash and short-term investments for investing into the business. On top of this, RB. has produced £2,422.0M in operating cash flow over the same time period, resulting in an operating cash to total debt ratio of 101.38%, meaning that RB.’s operating cash is sufficient to cover its debt. This ratio can also be interpreted as a measure of efficiency as an alternative to return on assets. In RB.’s case, it is able to generate 1.01x cash from its debt capital.
Can RB. pay its short-term liabilities?
Looking at RB.’s most recent £5,401.0M liabilities, it appears that the company has not been able to meet these commitments with a current assets level of £3,450.0M, leading to a 0.64x current account ratio. which is under the appropriate industry ratio of 3x.
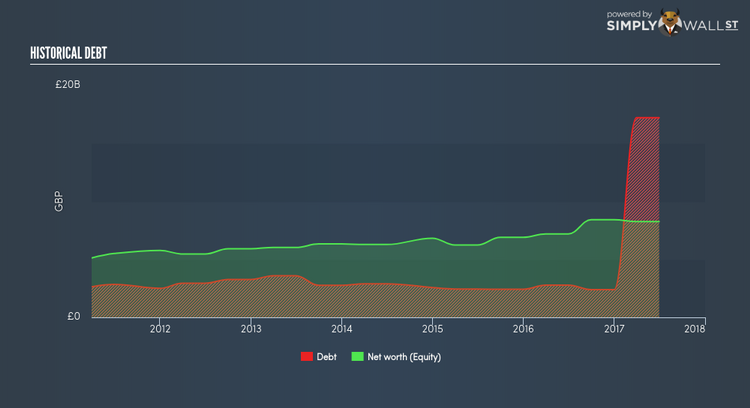
Can RB. service its debt comfortably?
With total debt exceeding equities, Reckitt Benckiser Group is considered a highly levered company. This is common amongst large-cap companies because debt can often be a less expensive alternative to equity due to tax deductibility of interest payments. Consequently, larger-cap organisations tend to enjoy lower cost of capital as a result of easily attained financing, providing an advantage over smaller companies. The sustainability of RB.’s debt levels can be assessed by comparing the company’s interest payments to earnings. Net interest should be covered by earnings before interest and tax (EBIT) by at least three times to be safe. In RB.’s case, the ratio of 145.27x suggests that interest is amply covered. High interest coverage is seen as a responsible and safe practice, which highlights why most investors believe large-caps such as RB. is a safe investment.
Next Steps:
RB.’s high cash coverage means that, although its debt levels are high, the company is able to utilise its borrowings efficiently in order to generate cash flow. However, its lack of liquidity raises questions over current asset management practices for the large-cap. I admit this is a fairly basic analysis for RB.’s financial health. Other important fundamentals need to be considered alongside. I suggest you continue to research Reckitt Benckiser Group to get a more holistic view of the stock by looking at:
1. Future Outlook: What are well-informed industry analysts predicting for RB.’s future growth? Take a look at our free research report of analyst consensus for RB.’s outlook.
2. Valuation: What is RB. worth today? Is the stock undervalued, even when its growth outlook is factored into its intrinsic value? The intrinsic value infographic in our free research report helps visualize whether RB. is currently mispriced by the market.
3. Other High-Performing Stocks: Are there other stocks that provide better prospects with proven track records? Explore our free list of these great stocks here.
To help readers see pass the short term volatility of the financial market, we aim to bring you a long-term focused research analysis purely driven by fundamental data. Note that our analysis does not factor in the latest price sensitive company announcements.
The author is an independent contributor and at the time of publication had no position in the stocks mentioned.
